
|
Pylon Technologies Co., Ltd. (688063.SS) Avaliação DCF |
Totalmente Editável: Adapte-Se Às Suas Necessidades No Excel Ou Planilhas
Design Profissional: Modelos Confiáveis E Padrão Da Indústria
Pré-Construídos Para Uso Rápido E Eficiente
Compatível com MAC/PC, totalmente desbloqueado
Não É Necessária Experiência; Fácil De Seguir
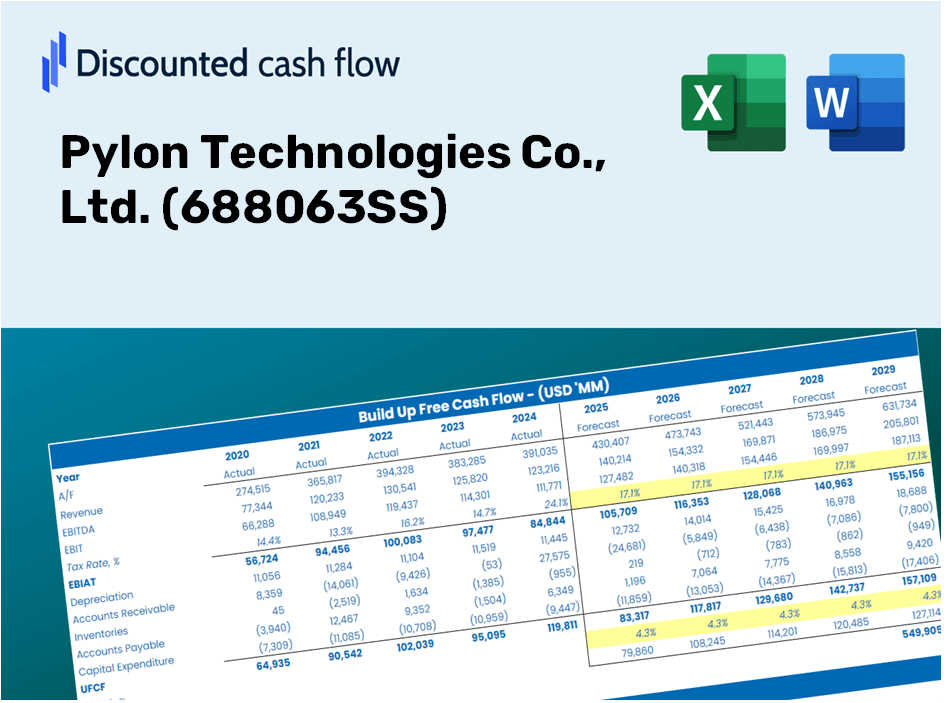
Pylon Technologies Co., Ltd. (688063.SS) Bundle
Como investidor ou analista, esta calculadora DCF [símbolo] é o seu recurso essencial para uma avaliação precisa. Pré -carregado com a Pylon Technologies Co., Ltd. Dados reais, você pode ajustar as previsões e observar instantaneamente os efeitos.
Discounted Cash Flow (DCF) - (USD MM)
| Year | AY1 2020 |
AY2 2021 |
AY3 2022 |
AY4 2023 |
AY5 2024 |
FY1 2025 |
FY2 2026 |
FY3 2027 |
FY4 2028 |
FY5 2029 |
|---|---|---|---|---|---|---|---|---|---|---|
| Revenue | 1,120.1 | 2,062.5 | 6,013.2 | 3,299.4 | 2,004.8 | 2,504.9 | 3,129.7 | 3,910.3 | 4,885.6 | 6,104.3 |
| Revenue Growth, % | 0 | 84.14 | 191.55 | -45.13 | -39.24 | 24.94 | 24.94 | 24.94 | 24.94 | 24.94 |
| EBITDA | 349.7 | 359.0 | 1,460.0 | 463.3 | 133.6 | 469.0 | 585.9 | 732.1 | 914.7 | 1,142.9 |
| EBITDA, % | 31.22 | 17.41 | 24.28 | 14.04 | 6.67 | 18.72 | 18.72 | 18.72 | 18.72 | 18.72 |
| Depreciation | 20.8 | 34.0 | 76.1 | 137.4 | 195.0 | 93.5 | 116.8 | 146.0 | 182.4 | 227.9 |
| Depreciation, % | 1.86 | 1.65 | 1.27 | 4.17 | 9.73 | 3.73 | 3.73 | 3.73 | 3.73 | 3.73 |
| EBIT | 328.9 | 325.0 | 1,383.9 | 325.8 | -61.4 | 375.5 | 469.1 | 586.1 | 732.3 | 915.0 |
| EBIT, % | 29.36 | 15.76 | 23.01 | 9.88 | -3.06 | 14.99 | 14.99 | 14.99 | 14.99 | 14.99 |
| Total Cash | 2,254.1 | 1,435.7 | 1,978.4 | 6,349.7 | 6,325.5 | 2,016.5 | 2,519.4 | 3,147.9 | 3,933.1 | 4,914.1 |
| Total Cash, percent | .0 | .0 | .0 | .0 | .0 | .0 | .0 | .0 | .0 | .0 |
| Account Receivables | 269.3 | 679.6 | 2,250.7 | 1,319.7 | 948.5 | 910.4 | 1,137.5 | 1,421.2 | 1,775.7 | 2,218.7 |
| Account Receivables, % | 24.04 | 32.95 | 37.43 | 40 | 47.31 | 36.35 | 36.35 | 36.35 | 36.35 | 36.35 |
| Inventories | 190.0 | 687.2 | 1,415.6 | 706.9 | 720.0 | 657.1 | 821.0 | 1,025.7 | 1,281.6 | 1,601.3 |
| Inventories, % | 16.96 | 33.32 | 23.54 | 21.42 | 35.91 | 26.23 | 26.23 | 26.23 | 26.23 | 26.23 |
| Accounts Payable | 342.8 | 829.1 | 1,680.2 | 1,014.5 | 1,140.6 | 933.8 | 1,166.7 | 1,457.7 | 1,821.3 | 2,275.5 |
| Accounts Payable, % | 30.61 | 40.2 | 27.94 | 30.75 | 56.89 | 37.28 | 37.28 | 37.28 | 37.28 | 37.28 |
| Capital Expenditure | -145.6 | -458.2 | -776.3 | -1,200.7 | -493.3 | -546.7 | -683.0 | -853.4 | -1,066.3 | -1,332.2 |
| Capital Expenditure, % | -13 | -22.22 | -12.91 | -36.39 | -24.6 | -21.82 | -21.82 | -21.82 | -21.82 | -21.82 |
| Tax Rate, % | 30.52 | 30.52 | 30.52 | 30.52 | 30.52 | 30.52 | 30.52 | 30.52 | 30.52 | 30.52 |
| EBITAT | 289.4 | 288.6 | 1,188.3 | 279.6 | -42.7 | 313.8 | 392.1 | 489.9 | 612.1 | 764.8 |
| Depreciation | ||||||||||
| Changes in Account Receivables | ||||||||||
| Changes in Inventories | ||||||||||
| Changes in Accounts Payable | ||||||||||
| Capital Expenditure | ||||||||||
| UFCF | 48.1 | -556.9 | -960.3 | 190.3 | 143.4 | -245.2 | -332.2 | -415.0 | -518.5 | -647.9 |
| WACC, % | 4.74 | 4.74 | 4.73 | 4.73 | 4.7 | 4.73 | 4.73 | 4.73 | 4.73 | 4.73 |
| PV UFCF | ||||||||||
| SUM PV UFCF | -1,843.6 | |||||||||
| Long Term Growth Rate, % | 3.50 | |||||||||
| Free cash flow (T + 1) | -671 | |||||||||
| Terminal Value | -54,581 | |||||||||
| Present Terminal Value | -43,322 | |||||||||
| Enterprise Value | -45,166 | |||||||||
| Net Debt | -3,172 | |||||||||
| Equity Value | -41,994 | |||||||||
| Diluted Shares Outstanding, MM | 242 | |||||||||
| Equity Value Per Share | -173.67 |
What You Will Receive
- Genuine Pylon Technologies Data: Comprehensive financials – from revenue to EBIT – derived from actual and forecasted figures.
- Complete Customization: Modify all essential parameters (yellow cells) such as WACC, growth %, and tax rates.
- Immediate Valuation Updates: Automatic recalculations to assess the effects of changes on Pylon Technologies' fair value.
- Flexible Excel Template: Designed for quick adjustments, scenario simulations, and detailed forecasts.
- Efficient and Precise: Eliminate the need to construct models from scratch while ensuring accuracy and adaptability.
Key Features
- Pre-Loaded Data: Pylon Technologies' historical financial statements and pre-filled forecasts.
- Fully Adjustable Inputs: Customize WACC, tax rates, revenue growth, and EBITDA margins.
- Instant Results: Watch Pylon Technologies' intrinsic value recalculate in real time.
- Clear Visual Outputs: Dashboard charts present valuation results and key metrics.
- Built for Accuracy: A professional tool designed for analysts, investors, and finance experts.
How It Operates
- Download: Obtain the pre-prepared Excel file containing Pylon Technologies Co., Ltd.'s (688063SS) financial figures.
- Customize: Modify projections such as revenue growth, EBITDA %, and WACC to fit your analysis.
- Update Automatically: Watch as intrinsic value and NPV calculations refresh in real-time.
- Test Scenarios: Develop various forecasts and instantly analyze comparative results.
- Make Decisions: Leverage the valuation findings to inform your investment approach.
Why Choose Pylon Technologies Co., Ltd. (688063SS)?
- All-in-One Solution: Combines DCF, WACC, and financial ratio analyses for comprehensive evaluations.
- Flexible Parameters: Modify the highlighted cells to explore different scenarios tailored to your needs.
- In-Depth Analysis: Automatically calculates Pylon's intrinsic value and Net Present Value for informed decision-making.
- Built-in Data: Comes with historical and projected data for a reliable foundation.
- High-Quality Output: Perfect for financial analysts, investors, and business consultants seeking precise insights.
Who Can Benefit from Pylon Technologies Co., Ltd. (688063SS)?
- Investors: Assess Pylon's market valuation before making stock trades.
- CFOs and Financial Analysts: Enhance valuation workflows and validate financial forecasts.
- Startup Founders: Discover how leading companies like Pylon are valued in the market.
- Consultants: Produce comprehensive valuation reports for client advisement.
- Students and Educators: Utilize real-time data to develop and apply valuation methodologies.
What the Template Offers
- Pre-Filled Data: Contains historical financials and future projections for Pylon Technologies Co., Ltd. (688063SS).
- Discounted Cash Flow Model: Customizable DCF valuation model with automated calculations.
- Weighted Average Cost of Capital (WACC): A specific sheet for WACC computation based on tailored inputs.
- Key Financial Ratios: Assess Pylon Technologies' profitability, efficiency, and leverage metrics.
- Customizable Inputs: Easily modify revenue growth rates, profit margins, and tax percentages.
- Comprehensive Dashboard: Visuals and tables that highlight essential valuation outcomes.
Disclaimer
All information, articles, and product details provided on this website are for general informational and educational purposes only. We do not claim any ownership over, nor do we intend to infringe upon, any trademarks, copyrights, logos, brand names, or other intellectual property mentioned or depicted on this site. Such intellectual property remains the property of its respective owners, and any references here are made solely for identification or informational purposes, without implying any affiliation, endorsement, or partnership.
We make no representations or warranties, express or implied, regarding the accuracy, completeness, or suitability of any content or products presented. Nothing on this website should be construed as legal, tax, investment, financial, medical, or other professional advice. In addition, no part of this site—including articles or product references—constitutes a solicitation, recommendation, endorsement, advertisement, or offer to buy or sell any securities, franchises, or other financial instruments, particularly in jurisdictions where such activity would be unlawful.
All content is of a general nature and may not address the specific circumstances of any individual or entity. It is not a substitute for professional advice or services. Any actions you take based on the information provided here are strictly at your own risk. You accept full responsibility for any decisions or outcomes arising from your use of this website and agree to release us from any liability in connection with your use of, or reliance upon, the content or products found herein.