
|
Shanghai Yizhong Pharmaceutical Co., Ltd. (688091.ss) DCF Avaliação |
Totalmente Editável: Adapte-Se Às Suas Necessidades No Excel Ou Planilhas
Design Profissional: Modelos Confiáveis E Padrão Da Indústria
Pré-Construídos Para Uso Rápido E Eficiente
Compatível com MAC/PC, totalmente desbloqueado
Não É Necessária Experiência; Fácil De Seguir
Shanghai Yizhong Pharmaceutical Co., Ltd. (688091.SS) Bundle
Obtenha informações sobre sua análise de avaliação de Shanghai Yizhong Pharmaceutical Co., Ltd. (688091SS) usando nossa sofisticada calculadora DCF! Este modelo do Excel é pré -carregado com dados autênticos (688091Ss), permitindo que você ajuste as previsões e suposições para determinar com precisão o valor intrínseco de Shanghai Yizhong Pharmaceutical Co., Ltd.
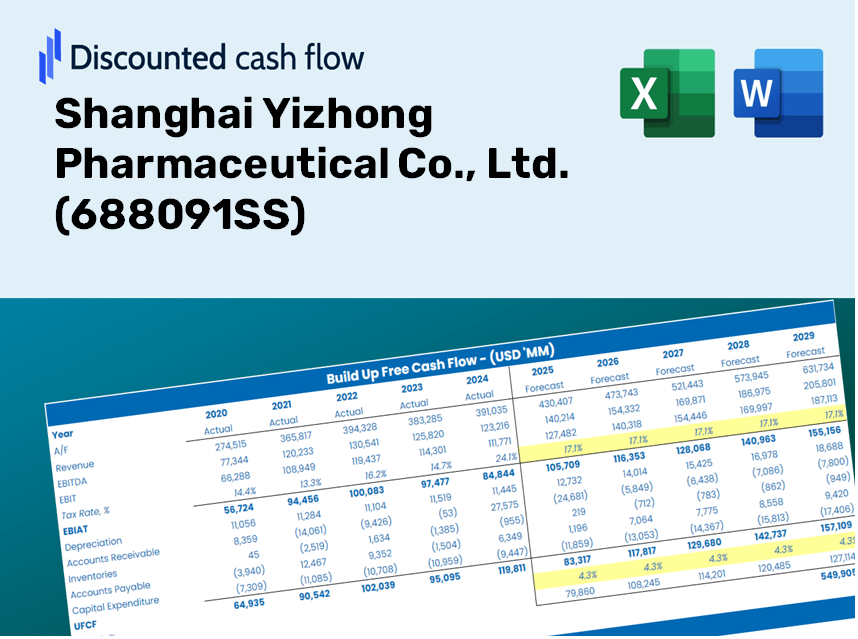
Discounted Cash Flow (DCF) - (USD MM)
| Year | AY1 2020 |
AY2 2021 |
AY3 2022 |
AY4 2023 |
AY5 2024 |
FY1 2025 |
FY2 2026 |
FY3 2027 |
FY4 2028 |
FY5 2029 |
|---|---|---|---|---|---|---|---|---|---|---|
| Revenue | .0 | 4.1 | 236.0 | 360.3 | 173.5 | 217.3 | 272.1 | 340.7 | 426.5 | 534.1 |
| Revenue Growth, % | 0 | 0 | 5686.75 | 52.68 | -51.83 | 25.21 | 25.21 | 25.21 | 25.21 | 25.21 |
| EBITDA | -23.9 | -20.4 | 115.9 | 167.4 | -4.8 | 40.3 | 50.5 | 63.2 | 79.2 | 99.1 |
| EBITDA, % | 100 | -500.25 | 49.12 | 46.48 | -2.79 | 18.56 | 18.56 | 18.56 | 18.56 | 18.56 |
| Depreciation | 6.2 | 6.6 | 6.4 | 7.9 | 11.2 | 91.8 | 115.0 | 144.0 | 180.3 | 225.8 |
| Depreciation, % | 100 | 161.71 | 2.72 | 2.19 | 6.43 | 42.27 | 42.27 | 42.27 | 42.27 | 42.27 |
| EBIT | -30.0 | -27.0 | 109.5 | 159.6 | -16.0 | 35.4 | 44.3 | 55.5 | 69.5 | 87.0 |
| EBIT, % | 100 | -661.96 | 46.4 | 44.29 | -9.23 | 16.29 | 16.29 | 16.29 | 16.29 | 16.29 |
| Total Cash | 51.1 | 953.1 | 1,049.3 | 1,240.2 | 666.1 | 217.3 | 272.1 | 340.7 | 426.5 | 534.1 |
| Total Cash, percent | .0 | .0 | .0 | .0 | .0 | .0 | .0 | .0 | .0 | .0 |
| Account Receivables | 4.6 | 4.1 | 42.5 | 143.2 | 54.5 | 125.6 | 157.3 | 197.0 | 246.6 | 308.8 |
| Account Receivables, % | 100 | 100.76 | 18 | 39.75 | 31.38 | 57.82 | 57.82 | 57.82 | 57.82 | 57.82 |
| Inventories | 1.5 | 11.8 | 17.1 | 28.4 | 45.2 | 104.8 | 131.2 | 164.3 | 205.7 | 257.6 |
| Inventories, % | 100 | 288.93 | 7.23 | 7.88 | 26.03 | 48.23 | 48.23 | 48.23 | 48.23 | 48.23 |
| Accounts Payable | 2.2 | 1.1 | 21.5 | 37.7 | 27.7 | 70.8 | 88.6 | 111.0 | 139.0 | 174.0 |
| Accounts Payable, % | 100 | 27.37 | 9.13 | 10.46 | 15.96 | 32.58 | 32.58 | 32.58 | 32.58 | 32.58 |
| Capital Expenditure | -5.0 | -3.1 | -35.9 | -8.8 | -80.0 | -61.2 | -76.6 | -96.0 | -120.1 | -150.4 |
| Capital Expenditure, % | 100 | -77.08 | -15.21 | -2.44 | -46.12 | -28.17 | -28.17 | -28.17 | -28.17 | -28.17 |
| Tax Rate, % | -44.8 | -44.8 | -44.8 | -44.8 | -44.8 | -44.8 | -44.8 | -44.8 | -44.8 | -44.8 |
| EBITAT | -30.0 | -11.6 | 104.6 | 137.9 | -23.2 | 30.1 | 37.7 | 47.2 | 59.1 | 74.0 |
| Depreciation | ||||||||||
| Changes in Account Receivables | ||||||||||
| Changes in Inventories | ||||||||||
| Changes in Accounts Payable | ||||||||||
| Capital Expenditure | ||||||||||
| UFCF | -32.8 | -19.0 | 51.9 | 41.1 | -30.1 | -27.0 | 35.8 | 44.8 | 56.1 | 70.3 |
| WACC, % | 4.68 | 4.68 | 4.68 | 4.68 | 4.68 | 4.68 | 4.68 | 4.68 | 4.68 | 4.68 |
| PV UFCF | ||||||||||
| SUM PV UFCF | 148.6 | |||||||||
| Long Term Growth Rate, % | 2.00 | |||||||||
| Free cash flow (T + 1) | 72 | |||||||||
| Terminal Value | 2,670 | |||||||||
| Present Terminal Value | 2,124 | |||||||||
| Enterprise Value | 2,273 | |||||||||
| Net Debt | -644 | |||||||||
| Equity Value | 2,917 | |||||||||
| Diluted Shares Outstanding, MM | 233 | |||||||||
| Equity Value Per Share | 12.55 |
What You Will Receive
- Authentic 688091SS Financial Data: Access both historical and projected figures for precise valuation.
- Customizable Inputs: Adjust parameters such as WACC, tax rates, revenue growth, and capital investments.
- Automated Calculations: Intrinsic value and NPV are computed in real-time.
- Scenario Analysis: Experiment with various scenarios to assess Shanghai Yizhong Pharmaceutical Co., Ltd.'s future performance.
- User-Friendly Design: Designed for professionals, yet approachable for novices.
Key Features
- Comprehensive Historical Data: Pre-filled with Shanghai Yizhong Pharmaceutical's (688091SS) past financial performance and future forecasts.
- Customizable Assumptions: Modify revenue growth rates, profit margins, discount rates, tax percentages, and capital expenditures as needed.
- Automated Valuation Model: Instant updates to Net Present Value (NPV) and intrinsic value based on your tailored inputs.
- Forecast Scenario Analysis: Develop various scenarios to evaluate different potential valuation results.
- Intuitive Interface: Designed to be easy to use for both seasoned professionals and newcomers.
How It Works
- Step 1: Download the prebuilt Excel template featuring Shanghai Yizhong Pharmaceutical Co., Ltd.’s (688091SS) data.
- Step 2: Examine the pre-filled sheets to familiarize yourself with the essential metrics.
- Step 3: Adjust forecasts and assumptions in the editable yellow cells (WACC, growth, margins).
- Step 4: Instantly see the recalculated outcomes, including the intrinsic value of Shanghai Yizhong Pharmaceutical Co., Ltd. (688091SS).
- Step 5: Utilize the results to make informed investment decisions or create reports.
Why Opt for This Calculator?
- User-Friendly: Tailored for both novices and seasoned professionals.
- Customizable Inputs: Easily adjust parameters to suit your analysis needs.
- Real-Time Updates: Instantly view changes to Shanghai Yizhong Pharmaceutical’s valuation as you modify inputs.
- Preloaded Data: Comes with Shanghai Yizhong Pharmaceutical's actual financial data for swift evaluations.
- Favored by Experts: Utilized by investors and analysts for sound decision-making.
Who Can Benefit from Our Products?
- Investors: Make informed investment choices with our advanced valuation tools at Shanghai Yizhong Pharmaceutical Co., Ltd. (688091SS).
- Financial Analysts: Streamline your workflow with our customizable DCF models specifically designed for the pharmaceutical industry.
- Consultants: Effortlessly modify our templates for impactful client presentations or detailed reports.
- Pharmaceutical Enthusiasts: Enhance your knowledge of valuation processes with practical, real-world applications.
- Educators and Students: Incorporate our resources as effective learning aids in finance and pharmaceutical courses.
What the Template Contains
- Pre-Filled DCF Model: Shanghai Yizhong Pharmaceutical’s financial data preloaded for immediate use.
- WACC Calculator: Comprehensive calculations for Weighted Average Cost of Capital.
- Financial Ratios: Assess Shanghai Yizhong Pharmaceutical’s profitability, leverage, and efficiency.
- Editable Inputs: Adjust assumptions like growth rates, margins, and capital expenditures to suit your scenarios.
- Financial Statements: Annual and quarterly reports to facilitate in-depth analysis.
- Interactive Dashboard: Easily visualize crucial valuation metrics and results.
Disclaimer
All information, articles, and product details provided on this website are for general informational and educational purposes only. We do not claim any ownership over, nor do we intend to infringe upon, any trademarks, copyrights, logos, brand names, or other intellectual property mentioned or depicted on this site. Such intellectual property remains the property of its respective owners, and any references here are made solely for identification or informational purposes, without implying any affiliation, endorsement, or partnership.
We make no representations or warranties, express or implied, regarding the accuracy, completeness, or suitability of any content or products presented. Nothing on this website should be construed as legal, tax, investment, financial, medical, or other professional advice. In addition, no part of this site—including articles or product references—constitutes a solicitation, recommendation, endorsement, advertisement, or offer to buy or sell any securities, franchises, or other financial instruments, particularly in jurisdictions where such activity would be unlawful.
All content is of a general nature and may not address the specific circumstances of any individual or entity. It is not a substitute for professional advice or services. Any actions you take based on the information provided here are strictly at your own risk. You accept full responsibility for any decisions or outcomes arising from your use of this website and agree to release us from any liability in connection with your use of, or reliance upon, the content or products found herein.