
|
Grupo da Indústria Nacional de Silício Co., Ltd. (688126.SS) Avaliação DCF |
Totalmente Editável: Adapte-Se Às Suas Necessidades No Excel Ou Planilhas
Design Profissional: Modelos Confiáveis E Padrão Da Indústria
Pré-Construídos Para Uso Rápido E Eficiente
Compatível com MAC/PC, totalmente desbloqueado
Não É Necessária Experiência; Fácil De Seguir
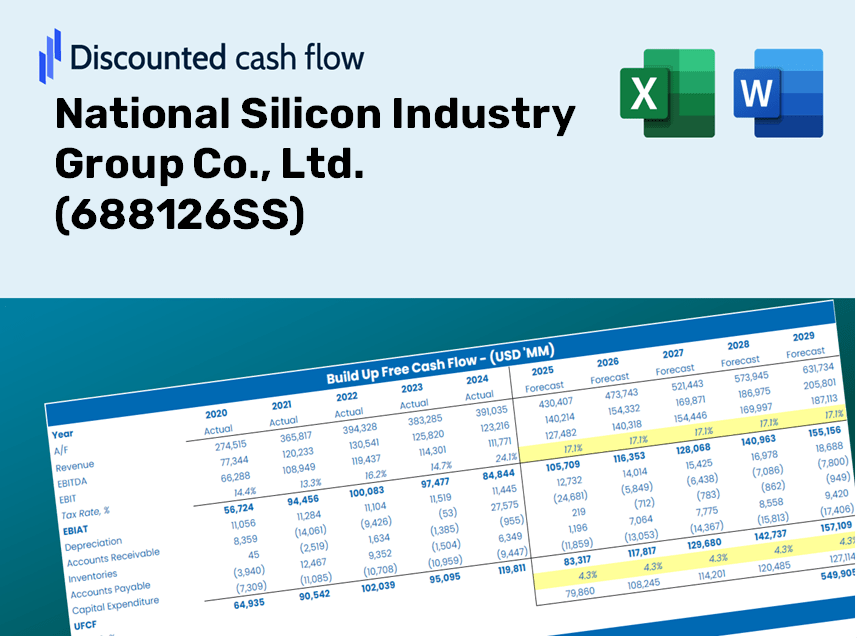
National Silicon Industry Group Co., Ltd. (688126.SS) Bundle
Seja você um investidor ou analista, esta (688126SS) calculadora DCF é o seu recurso preferido para uma avaliação precisa. Pré -carregado com dados reais da National Silicon Industry Group Co., Ltd., você pode ajustar as previsões e observar instantaneamente os efeitos.
Discounted Cash Flow (DCF) - (USD MM)
| Year | AY1 2020 |
AY2 2021 |
AY3 2022 |
AY4 2023 |
AY5 2024 |
FY1 2025 |
FY2 2026 |
FY3 2027 |
FY4 2028 |
FY5 2029 |
|---|---|---|---|---|---|---|---|---|---|---|
| Revenue | 1,811.3 | 2,466.8 | 3,600.4 | 3,190.3 | 3,387.6 | 4,039.2 | 4,816.1 | 5,742.5 | 6,847.1 | 8,164.1 |
| Revenue Growth, % | 0 | 36.19 | 45.95 | -11.39 | 6.18 | 19.23 | 19.23 | 19.23 | 19.23 | 19.23 |
| EBITDA | 226.4 | 386.0 | 785.9 | 531.0 | -138.7 | 505.1 | 602.3 | 718.1 | 856.2 | 1,020.9 |
| EBITDA, % | 12.5 | 15.65 | 21.83 | 16.64 | -4.1 | 12.51 | 12.51 | 12.51 | 12.51 | 12.51 |
| Depreciation | 403.4 | 465.4 | 577.3 | 701.9 | 918.6 | 858.7 | 1,023.8 | 1,220.7 | 1,455.5 | 1,735.5 |
| Depreciation, % | 22.27 | 18.87 | 16.03 | 22 | 27.12 | 21.26 | 21.26 | 21.26 | 21.26 | 21.26 |
| EBIT | -176.9 | -79.5 | 208.6 | -170.9 | -1,057.3 | -353.5 | -421.6 | -502.6 | -599.3 | -714.6 |
| EBIT, % | -9.77 | -3.22 | 5.79 | -5.36 | -31.21 | -8.75 | -8.75 | -8.75 | -8.75 | -8.75 |
| Total Cash | 2,167.6 | 1,257.9 | 8,861.5 | 7,717.5 | 5,381.9 | 3,643.3 | 4,344.1 | 5,179.7 | 6,176.0 | 7,363.9 |
| Total Cash, percent | .0 | .0 | .0 | .0 | .0 | .0 | .0 | .0 | .0 | .0 |
| Account Receivables | 552.4 | 666.4 | 936.5 | 636.5 | 1,021.7 | 1,079.6 | 1,287.2 | 1,534.8 | 1,830.0 | 2,182.0 |
| Account Receivables, % | 30.5 | 27.01 | 26.01 | 19.95 | 30.16 | 26.73 | 26.73 | 26.73 | 26.73 | 26.73 |
| Inventories | 555.2 | 677.9 | 823.1 | 1,449.0 | 1,541.7 | 1,388.9 | 1,656.0 | 1,974.6 | 2,354.4 | 2,807.2 |
| Inventories, % | 30.65 | 27.48 | 22.86 | 45.42 | 45.51 | 34.39 | 34.39 | 34.39 | 34.39 | 34.39 |
| Accounts Payable | 203.5 | 234.1 | 313.1 | 320.7 | 573.9 | 455.8 | 543.4 | 647.9 | 772.6 | 921.2 |
| Accounts Payable, % | 11.24 | 9.49 | 8.7 | 10.05 | 16.94 | 11.28 | 11.28 | 11.28 | 11.28 | 11.28 |
| Capital Expenditure | -1,177.5 | -1,323.8 | -2,660.0 | -4,126.5 | -5,069.0 | -3,171.2 | -3,781.2 | -4,508.5 | -5,375.7 | -6,409.7 |
| Capital Expenditure, % | -65.01 | -53.66 | -73.88 | -129.34 | -149.63 | -78.51 | -78.51 | -78.51 | -78.51 | -78.51 |
| Tax Rate, % | 16.64 | 16.64 | 16.64 | 16.64 | 16.64 | 16.64 | 16.64 | 16.64 | 16.64 | 16.64 |
| EBITAT | -135.0 | -73.8 | 168.1 | -179.4 | -881.4 | -306.2 | -365.1 | -435.4 | -519.1 | -618.9 |
| Depreciation | ||||||||||
| Changes in Account Receivables | ||||||||||
| Changes in Inventories | ||||||||||
| Changes in Accounts Payable | ||||||||||
| Capital Expenditure | ||||||||||
| UFCF | -1,813.3 | -1,138.2 | -2,250.8 | -3,922.3 | -5,256.4 | -2,642.0 | -3,509.6 | -4,184.7 | -4,989.6 | -5,949.4 |
| WACC, % | 5.19 | 5.24 | 5.21 | 5.27 | 5.21 | 5.22 | 5.22 | 5.22 | 5.22 | 5.22 |
| PV UFCF | ||||||||||
| SUM PV UFCF | -17,954.5 | |||||||||
| Long Term Growth Rate, % | 2.00 | |||||||||
| Free cash flow (T + 1) | -6,068 | |||||||||
| Terminal Value | -188,201 | |||||||||
| Present Terminal Value | -145,895 | |||||||||
| Enterprise Value | -163,849 | |||||||||
| Net Debt | 217 | |||||||||
| Equity Value | -164,067 | |||||||||
| Diluted Shares Outstanding, MM | 2,749 | |||||||||
| Equity Value Per Share | -59.67 |
Benefits You Will Receive
- Pre-Filled Financial Model: Leverage National Silicon Industry Group Co., Ltd.’s (688126SS) actual data for accurate DCF valuation.
- Comprehensive Forecast Control: Modify revenue growth, profit margins, WACC, and other crucial variables.
- Real-Time Calculations: Automatic adjustments provide immediate feedback as you make modifications.
- Professional-Grade Template: A polished Excel file crafted for high-standard valuation.
- Customizable and Repeatable: Designed for adaptability, enabling extensive usage for in-depth forecasts.
Key Features
- Comprehensive Historical Data: National Silicon Industry Group Co., Ltd.'s (688126SS) previous financial reports and projected forecasts.
- Customizable Parameters: Modify WACC, tax rates, revenue growth, and EBITDA margins to suit your analysis.
- Real-Time Valuation: Observe the recalculation of National Silicon’s (688126SS) intrinsic value instantly.
- Intuitive Visual Displays: Dashboard graphs present valuation outcomes and essential metrics clearly.
- Designed for Precision: A reliable tool tailored for analysts, investors, and finance professionals.
How It Operates
- Download the Template: Gain immediate access to the Excel-based NSIG DCF Calculator.
- Enter Your Assumptions: Modify the yellow-highlighted cells for growth rates, WACC, margins, and additional factors.
- Instant Evaluations: The model automatically refreshes to show the intrinsic value of National Silicon Industry Group Co., Ltd. (688126SS).
- Explore Scenarios: Test various assumptions to assess potential changes in valuation.
- Analyze and Make Decisions: Leverage the results to inform your investment strategies or financial assessments.
Why Choose This Calculator for National Silicon Industry Group Co., Ltd. (688126SS)?
- User-Friendly Interface: Tailored for both novices and seasoned professionals.
- Customizable Parameters: Easily adjust inputs to suit your analysis needs.
- Real-Time Feedback: Instantly observe changes in the valuation of National Silicon as you modify inputs.
- Preloaded Data: Comes equipped with National Silicon’s current financial information for swift evaluations.
- Relied Upon by Experts: Favored by investors and analysts for making well-informed decisions.
Who Can Benefit from National Silicon Industry Group Co., Ltd. (688126SS)?
- Investors: Gain insights and make informed decisions with our advanced valuation resources.
- Financial Analysts: Enhance efficiency with our customizable financial models designed for quick adaptations.
- Consultants: Effortlessly tailor our templates for impactful client presentations and comprehensive reports.
- Finance Enthusiasts: Expand your knowledge of valuation methods through practical, real-life applications.
- Educators and Students: Utilize our tools as effective resources in finance courses for enhanced learning experiences.
What the Template Contains
- Historical Data: Contains National Silicon Industry Group Co., Ltd.'s past financials and baseline forecasts.
- DCF and Levered DCF Models: Comprehensive templates to assess the intrinsic value of National Silicon Industry Group Co., Ltd. (688126SS).
- WACC Sheet: Pre-calculated metrics for the Weighted Average Cost of Capital.
- Editable Inputs: Customize critical drivers such as growth rates, EBITDA %, and CAPEX projections.
- Quarterly and Annual Statements: A detailed analysis of National Silicon Industry Group Co., Ltd.'s financial performance.
- Interactive Dashboard: Dynamically visualize valuation outcomes and future projections.
Disclaimer
All information, articles, and product details provided on this website are for general informational and educational purposes only. We do not claim any ownership over, nor do we intend to infringe upon, any trademarks, copyrights, logos, brand names, or other intellectual property mentioned or depicted on this site. Such intellectual property remains the property of its respective owners, and any references here are made solely for identification or informational purposes, without implying any affiliation, endorsement, or partnership.
We make no representations or warranties, express or implied, regarding the accuracy, completeness, or suitability of any content or products presented. Nothing on this website should be construed as legal, tax, investment, financial, medical, or other professional advice. In addition, no part of this site—including articles or product references—constitutes a solicitation, recommendation, endorsement, advertisement, or offer to buy or sell any securities, franchises, or other financial instruments, particularly in jurisdictions where such activity would be unlawful.
All content is of a general nature and may not address the specific circumstances of any individual or entity. It is not a substitute for professional advice or services. Any actions you take based on the information provided here are strictly at your own risk. You accept full responsibility for any decisions or outcomes arising from your use of this website and agree to release us from any liability in connection with your use of, or reliance upon, the content or products found herein.