
|
Pequim Roborock Technology Co., Ltd. (688169.Ss) Avaliação DCF |
Totalmente Editável: Adapte-Se Às Suas Necessidades No Excel Ou Planilhas
Design Profissional: Modelos Confiáveis E Padrão Da Indústria
Pré-Construídos Para Uso Rápido E Eficiente
Compatível com MAC/PC, totalmente desbloqueado
Não É Necessária Experiência; Fácil De Seguir
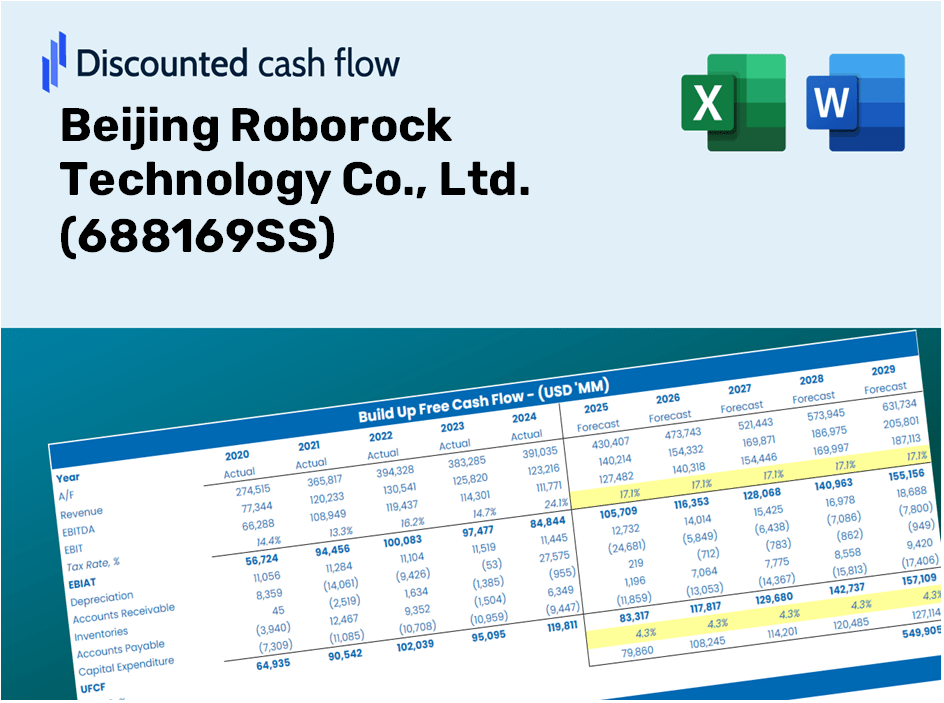
Beijing Roborock Technology Co., Ltd. (688169.SS) Bundle
Aprimore suas estratégias de investimento com a calculadora (688169SS) DCF! Explore dados financeiros reais da Pequim Roborock Technology Co., Ltd., ajuste as projeções e despesas de crescimento e observe instantaneamente como essas modificações afetam o valor intrínseco de (688169Ss).
Discounted Cash Flow (DCF) - (USD MM)
| Year | AY1 2020 |
AY2 2021 |
AY3 2022 |
AY4 2023 |
AY5 2024 |
FY1 2025 |
FY2 2026 |
FY3 2027 |
FY4 2028 |
FY5 2029 |
|---|---|---|---|---|---|---|---|---|---|---|
| Revenue | 4,530.4 | 5,837.1 | 6,628.7 | 8,653.8 | 11,944.7 | 15,258.8 | 19,492.5 | 24,900.8 | 31,809.6 | 40,635.4 |
| Revenue Growth, % | 0 | 28.84 | 13.56 | 30.55 | 38.03 | 27.75 | 27.75 | 27.75 | 27.75 | 27.75 |
| EBITDA | 1,406.4 | 1,354.8 | 1,404.3 | 2,194.5 | 1,835.4 | 3,545.0 | 4,528.6 | 5,785.1 | 7,390.1 | 9,440.6 |
| EBITDA, % | 31.04 | 23.21 | 21.19 | 25.36 | 15.37 | 23.23 | 23.23 | 23.23 | 23.23 | 23.23 |
| Depreciation | 40.6 | 35.6 | 92.3 | 107.7 | 117.1 | 156.3 | 199.7 | 255.1 | 325.9 | 416.3 |
| Depreciation, % | 0.89619 | 0.60943 | 1.39 | 1.24 | 0.98002 | 1.02 | 1.02 | 1.02 | 1.02 | 1.02 |
| EBIT | 1,365.8 | 1,319.2 | 1,312.0 | 2,086.8 | 1,718.4 | 3,388.7 | 4,328.9 | 5,529.9 | 7,064.3 | 9,024.3 |
| EBIT, % | 30.15 | 22.6 | 19.79 | 24.11 | 14.39 | 22.21 | 22.21 | 22.21 | 22.21 | 22.21 |
| Total Cash | 5,221.0 | 5,373.5 | 5,599.9 | 6,724.2 | 6,454.9 | 12,459.8 | 15,916.8 | 20,333.0 | 25,974.5 | 33,181.2 |
| Total Cash, percent | .0 | .0 | .0 | .0 | .0 | .0 | .0 | .0 | .0 | .0 |
| Account Receivables | 175.5 | 450.9 | 388.4 | 274.7 | 1,906.7 | 1,116.8 | 1,426.6 | 1,822.4 | 2,328.1 | 2,974.0 |
| Account Receivables, % | 3.87 | 7.72 | 5.86 | 3.17 | 15.96 | 7.32 | 7.32 | 7.32 | 7.32 | 7.32 |
| Inventories | 381.0 | 595.6 | 693.7 | 928.2 | 1,490.1 | 1,595.5 | 2,038.1 | 2,603.6 | 3,326.0 | 4,248.8 |
| Inventories, % | 8.41 | 10.2 | 10.46 | 10.73 | 12.47 | 10.46 | 10.46 | 10.46 | 10.46 | 10.46 |
| Accounts Payable | 56.1 | 325.5 | 227.3 | 1,499.1 | 2,824.8 | 1,563.0 | 1,996.7 | 2,550.6 | 3,258.3 | 4,162.4 |
| Accounts Payable, % | 1.24 | 5.58 | 3.43 | 17.32 | 23.65 | 10.24 | 10.24 | 10.24 | 10.24 | 10.24 |
| Capital Expenditure | -989.4 | -439.3 | -254.8 | -247.8 | -292.5 | -1,175.6 | -1,501.8 | -1,918.4 | -2,450.7 | -3,130.7 |
| Capital Expenditure, % | -21.84 | -7.53 | -3.84 | -2.86 | -2.45 | -7.7 | -7.7 | -7.7 | -7.7 | -7.7 |
| Tax Rate, % | 5.77 | 5.77 | 5.77 | 5.77 | 5.77 | 5.77 | 5.77 | 5.77 | 5.77 | 5.77 |
| EBITAT | 1,201.7 | 1,157.7 | 1,150.8 | 1,845.2 | 1,619.3 | 3,023.5 | 3,862.4 | 4,934.0 | 6,303.0 | 8,051.8 |
| Depreciation | ||||||||||
| Changes in Account Receivables | ||||||||||
| Changes in Inventories | ||||||||||
| Changes in Accounts Payable | ||||||||||
| Capital Expenditure | ||||||||||
| UFCF | -247.6 | 533.5 | 854.6 | 2,856.1 | 575.6 | 1,427.0 | 2,241.5 | 2,863.4 | 3,657.8 | 4,672.7 |
| WACC, % | 9.37 | 9.37 | 9.37 | 9.37 | 9.38 | 9.37 | 9.37 | 9.37 | 9.37 | 9.37 |
| PV UFCF | ||||||||||
| SUM PV UFCF | 10,909.2 | |||||||||
| Long Term Growth Rate, % | 3.50 | |||||||||
| Free cash flow (T + 1) | 4,836 | |||||||||
| Terminal Value | 82,372 | |||||||||
| Present Terminal Value | 52,633 | |||||||||
| Enterprise Value | 63,543 | |||||||||
| Net Debt | -1,310 | |||||||||
| Equity Value | 64,853 | |||||||||
| Diluted Shares Outstanding, MM | 185 | |||||||||
| Equity Value Per Share | 351.40 |
What You Will Receive
- Pre-Configured Financial Model: Leverage Roborock's actual data for accurate DCF valuation.
- Comprehensive Forecast Control: Modify revenue growth, profit margins, WACC, and other essential parameters.
- Real-Time Calculations: Automated updates provide immediate results as adjustments are made.
- Professional-Grade Template: A polished Excel file crafted for high-level valuation.
- Flexible and Reusable: Designed for customization, enabling repeated applications for in-depth forecasts.
Key Features
- Pre-Loaded Data: Historical financial statements and pre-filled forecasts for Beijing Roborock Technology Co., Ltd. (688169SS).
- Fully Adjustable Inputs: Customize WACC, tax rates, revenue growth, and EBITDA margins to suit your analysis.
- Instant Results: Watch the intrinsic value of Beijing Roborock Technology Co., Ltd. (688169SS) update in real time.
- Clear Visual Outputs: Dashboard charts showcase valuation results and essential metrics for better understanding.
- Built for Accuracy: A professional-grade tool designed for analysts, investors, and finance professionals.
How It Works
- Step 1: Download the Excel file.
- Step 2: Examine the pre-filled financial data and forecasts for Beijing Roborock Technology Co., Ltd. (688169SS).
- Step 3: Adjust key inputs such as revenue growth, WACC, and tax rates (highlighted cells).
- Step 4: Observe the DCF model update in real-time as you modify your assumptions.
- Step 5: Review the outputs and leverage the results for your investment strategies.
Why Opt for This Calculator?
- All-in-One Solution: Integrates DCF, WACC, and financial ratio assessments into a single tool.
- Flexible Inputs: Modify the yellow-highlighted fields to explore different scenarios.
- In-Depth Analysis: Automatically determines the intrinsic value and Net Present Value for Beijing Roborock Technology Co., Ltd. (688169SS).
- Preloaded Information: Comes with historical and projected data for reliable baseline calculations.
- Expert-Level Quality: Perfectly suited for financial analysts, investors, and business advisors.
Who Can Benefit from This Product?
- Investors: Evaluate Beijing Roborock Technology Co., Ltd.'s valuation before making stock transactions.
- CFOs and Financial Analysts: Enhance valuation methodologies and validate financial forecasts.
- Startup Founders: Gain insights into how established firms like Beijing Roborock Technology are appraised.
- Consultants: Create comprehensive valuation reports for your clientele.
- Students and Educators: Apply real-life data to refine and instruct on valuation practices.
What the Template Includes
- Preloaded ROBOROCK Data: Historical and projected financial metrics, encompassing revenue, EBIT, and capital expenditures.
- DCF and WACC Models: Expert-level sheets designed to calculate intrinsic value and Weighted Average Cost of Capital.
- Editable Inputs: Yellow-highlighted cells for modifying revenue growth, tax rates, and discount rates.
- Financial Statements: Detailed annual and quarterly financial statements for thorough analysis.
- Key Ratios: Metrics for profitability, leverage, and efficiency to assess performance.
- Dashboard and Charts: Visual representations of valuation results and underlying assumptions.
Disclaimer
All information, articles, and product details provided on this website are for general informational and educational purposes only. We do not claim any ownership over, nor do we intend to infringe upon, any trademarks, copyrights, logos, brand names, or other intellectual property mentioned or depicted on this site. Such intellectual property remains the property of its respective owners, and any references here are made solely for identification or informational purposes, without implying any affiliation, endorsement, or partnership.
We make no representations or warranties, express or implied, regarding the accuracy, completeness, or suitability of any content or products presented. Nothing on this website should be construed as legal, tax, investment, financial, medical, or other professional advice. In addition, no part of this site—including articles or product references—constitutes a solicitation, recommendation, endorsement, advertisement, or offer to buy or sell any securities, franchises, or other financial instruments, particularly in jurisdictions where such activity would be unlawful.
All content is of a general nature and may not address the specific circumstances of any individual or entity. It is not a substitute for professional advice or services. Any actions you take based on the information provided here are strictly at your own risk. You accept full responsibility for any decisions or outcomes arising from your use of this website and agree to release us from any liability in connection with your use of, or reliance upon, the content or products found herein.