
|
Guo Tai Epoint Software Co., Ltd. (688232.SS) Avaliação do DCF |
Totalmente Editável: Adapte-Se Às Suas Necessidades No Excel Ou Planilhas
Design Profissional: Modelos Confiáveis E Padrão Da Indústria
Pré-Construídos Para Uso Rápido E Eficiente
Compatível com MAC/PC, totalmente desbloqueado
Não É Necessária Experiência; Fácil De Seguir
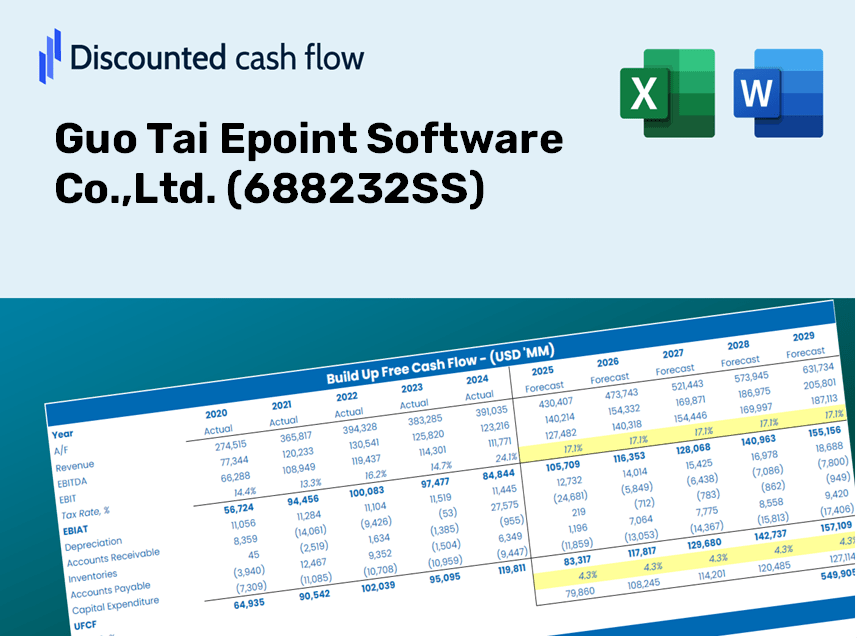
Guo Tai Epoint Software Co.,Ltd. (688232.SS) Bundle
Explore o futuro financeiro da Guo Tai Epoint Software Co., Ltd. (688232Ss) com nossa calculadora DCF amigável! Digite suas projeções de crescimento, margens e despesas para calcular o valor intrínseco da Guo Tai Epoint Software Co., Ltd. (688232Ss) e aprimore suas decisões de investimento.
Discounted Cash Flow (DCF) - (USD MM)
| Year | AY1 2020 |
AY2 2021 |
AY3 2022 |
AY4 2023 |
AY5 2024 |
FY1 2025 |
FY2 2026 |
FY3 2027 |
FY4 2028 |
FY5 2029 |
|---|---|---|---|---|---|---|---|---|---|---|
| Revenue | 2,124.1 | 2,794.4 | 2,824.3 | 2,441.2 | 2,146.3 | 2,183.8 | 2,221.9 | 2,260.7 | 2,300.1 | 2,340.3 |
| Revenue Growth, % | 0 | 31.56 | 1.07 | -13.56 | -12.08 | 1.75 | 1.75 | 1.75 | 1.75 | 1.75 |
| EBITDA | 460.6 | 554.9 | 471.3 | 79.4 | 118.7 | 292.7 | 297.8 | 303.0 | 308.3 | 313.7 |
| EBITDA, % | 21.69 | 19.86 | 16.69 | 3.25 | 5.53 | 13.4 | 13.4 | 13.4 | 13.4 | 13.4 |
| Depreciation | 26.8 | 31.7 | 38.5 | 39.6 | 32.0 | 30.0 | 30.6 | 31.1 | 31.6 | 32.2 |
| Depreciation, % | 1.26 | 1.14 | 1.36 | 1.62 | 1.49 | 1.38 | 1.38 | 1.38 | 1.38 | 1.38 |
| EBIT | 433.9 | 523.2 | 432.7 | 39.8 | 86.7 | 262.7 | 267.2 | 271.9 | 276.7 | 281.5 |
| EBIT, % | 20.43 | 18.72 | 15.32 | 1.63 | 4.04 | 12.03 | 12.03 | 12.03 | 12.03 | 12.03 |
| Total Cash | 428.2 | 4,371.4 | 4,311.0 | 3,475.6 | 3,735.8 | 1,835.1 | 1,867.1 | 1,899.7 | 1,932.9 | 1,966.6 |
| Total Cash, percent | .0 | .0 | .0 | .0 | .0 | .0 | .0 | .0 | .0 | .0 |
| Account Receivables | 914.5 | 1,140.2 | 1,509.4 | 1,488.9 | 1,455.5 | 1,162.2 | 1,182.5 | 1,203.2 | 1,224.2 | 1,245.5 |
| Account Receivables, % | 43.05 | 40.8 | 53.44 | 60.99 | 67.82 | 53.22 | 53.22 | 53.22 | 53.22 | 53.22 |
| Inventories | 432.0 | 455.1 | 434.4 | 416.6 | 402.0 | 383.5 | 390.2 | 397.0 | 403.9 | 411.0 |
| Inventories, % | 20.34 | 16.29 | 15.38 | 17.07 | 18.73 | 17.56 | 17.56 | 17.56 | 17.56 | 17.56 |
| Accounts Payable | 167.4 | 227.1 | 282.4 | 342.7 | 374.4 | 251.1 | 255.5 | 259.9 | 264.5 | 269.1 |
| Accounts Payable, % | 7.88 | 8.13 | 10 | 14.04 | 17.44 | 11.5 | 11.5 | 11.5 | 11.5 | 11.5 |
| Capital Expenditure | -91.1 | -77.9 | -102.5 | -233.7 | -391.0 | -168.1 | -171.1 | -174.1 | -177.1 | -180.2 |
| Capital Expenditure, % | -4.29 | -2.79 | -3.63 | -9.57 | -18.22 | -7.7 | -7.7 | -7.7 | -7.7 | -7.7 |
| Tax Rate, % | 1.86 | 1.86 | 1.86 | 1.86 | 1.86 | 1.86 | 1.86 | 1.86 | 1.86 | 1.86 |
| EBITAT | 395.8 | 472.1 | 415.0 | 42.9 | 85.1 | 249.8 | 254.2 | 258.6 | 263.1 | 267.7 |
| Depreciation | ||||||||||
| Changes in Account Receivables | ||||||||||
| Changes in Inventories | ||||||||||
| Changes in Accounts Payable | ||||||||||
| Capital Expenditure | ||||||||||
| UFCF | -847.7 | 236.8 | 57.8 | -52.6 | -194.1 | 300.2 | 91.0 | 92.6 | 94.2 | 95.9 |
| WACC, % | 4.71 | 4.71 | 4.71 | 4.71 | 4.71 | 4.71 | 4.71 | 4.71 | 4.71 | 4.71 |
| PV UFCF | ||||||||||
| SUM PV UFCF | 605.0 | |||||||||
| Long Term Growth Rate, % | 2.00 | |||||||||
| Free cash flow (T + 1) | 98 | |||||||||
| Terminal Value | 3,611 | |||||||||
| Present Terminal Value | 2,869 | |||||||||
| Enterprise Value | 3,474 | |||||||||
| Net Debt | -727 | |||||||||
| Equity Value | 4,201 | |||||||||
| Diluted Shares Outstanding, MM | 326 | |||||||||
| Equity Value Per Share | 12.87 |
Benefits You Will Receive
- Adjustable Forecast Parameters: Modify key assumptions (growth %, margins, WACC) effortlessly to generate various scenarios.
- Accurate Financial Data: Pre-loaded financial information from Guo Tai Epoint Software Co., Ltd. ([688232SS]) to facilitate your analysis.
- Instant DCF Results: The template automatically computes Net Present Value (NPV) and intrinsic value for your convenience.
- Tailored and Professional Design: A sleek Excel model customized to meet your valuation requirements.
- Designed for Analysts and Investors: Perfect for evaluating projections, confirming strategies, and enhancing efficiency.
Key Features
- Authentic Financial Data: Gain access to reliable pre-populated historical figures and forecasts for Guo Tai Epoint Software Co., Ltd. (688232SS).
- Adjustable Forecast Parameters: Modify highlighted fields such as WACC, growth rates, and profit margins.
- Automated Calculations: Instant updates to DCF, Net Present Value (NPV), and cash flow assessments.
- User-Friendly Dashboard: Clear charts and summaries to help you visualize your valuation findings.
- Designed for All Skill Levels: An intuitive framework tailored for investors, CFOs, and consultants alike.
How It Works
- Step 1: Download the Excel file.
- Step 2: Review Guo Tai Epoint Software Co., Ltd.'s pre-filled financial data and forecasts.
- Step 3: Adjust key inputs such as revenue growth, WACC, and tax rates (highlighted cells).
- Step 4: Observe the DCF model update in real time as you modify your assumptions.
- Step 5: Evaluate the outputs and utilize the findings for your investment strategies.
Why Opt for Guo Tai Epoint Software Co., Ltd.?
- Tailored for Industry Experts: A sophisticated solution designed for analysts, CFOs, and consultants.
- Up-to-Date Data: Historical and projected financial information for Guo Tai Epoint preloaded for precision.
- Flexible Scenario Analysis: Easily simulate various forecasts and assumptions.
- Comprehensive Outputs: Automatically computes intrinsic value, NPV, and essential metrics.
- User-Friendly: Step-by-step guidance ensures a smooth experience throughout the process.
Who Can Benefit from This Software?
- Finance Students: Master valuation methodologies and put them into practice with real data insights.
- Academics: Enrich your lectures and research by integrating industry-standard models.
- Investors: Validate your hypotheses and scrutinize valuation analyses for Guo Tai Epoint Software Co.,Ltd. (688232SS).
- Analysts: Enhance your efficiency with a customizable, ready-to-use DCF model.
- Small Business Owners: Discover how major public entities like Guo Tai Epoint Software Co.,Ltd. (688232SS) are evaluated in the market.
Contents of the Template
- Pre-Filled DCF Model: Guo Tai Epoint Software Co.,Ltd.'s financial data preloaded for immediate use.
- WACC Calculator: Comprehensive calculations for Weighted Average Cost of Capital.
- Financial Ratios: Assess Guo Tai Epoint's profitability, leverage, and operational efficiency.
- Editable Inputs: Customize assumptions such as growth rates, margins, and CAPEX to suit your specific scenarios.
- Financial Statements: Access annual and quarterly reports for in-depth analysis.
- Interactive Dashboard: Visually explore key valuation metrics and outcomes with ease.
Disclaimer
All information, articles, and product details provided on this website are for general informational and educational purposes only. We do not claim any ownership over, nor do we intend to infringe upon, any trademarks, copyrights, logos, brand names, or other intellectual property mentioned or depicted on this site. Such intellectual property remains the property of its respective owners, and any references here are made solely for identification or informational purposes, without implying any affiliation, endorsement, or partnership.
We make no representations or warranties, express or implied, regarding the accuracy, completeness, or suitability of any content or products presented. Nothing on this website should be construed as legal, tax, investment, financial, medical, or other professional advice. In addition, no part of this site—including articles or product references—constitutes a solicitation, recommendation, endorsement, advertisement, or offer to buy or sell any securities, franchises, or other financial instruments, particularly in jurisdictions where such activity would be unlawful.
All content is of a general nature and may not address the specific circumstances of any individual or entity. It is not a substitute for professional advice or services. Any actions you take based on the information provided here are strictly at your own risk. You accept full responsibility for any decisions or outcomes arising from your use of this website and agree to release us from any liability in connection with your use of, or reliance upon, the content or products found herein.