
|
XIAMEN AMOYTOP Biotech Co., Ltd. (688278.SS) Avaliação DCF |
Totalmente Editável: Adapte-Se Às Suas Necessidades No Excel Ou Planilhas
Design Profissional: Modelos Confiáveis E Padrão Da Indústria
Pré-Construídos Para Uso Rápido E Eficiente
Compatível com MAC/PC, totalmente desbloqueado
Não É Necessária Experiência; Fácil De Seguir
Xiamen Amoytop Biotech Co., Ltd. (688278.SS) Bundle
Explore as perspectivas financeiras da Xiamen Amoytop Biotech Co., Ltd. (688278Ss) com nossa calculadora DCF amigável! Digite suas projeções de crescimento, margens e custos para calcular o valor intrínseco da Xiamen Amoytop Biotech Co., Ltd. (688278Ss) e informe suas decisões de investimento.
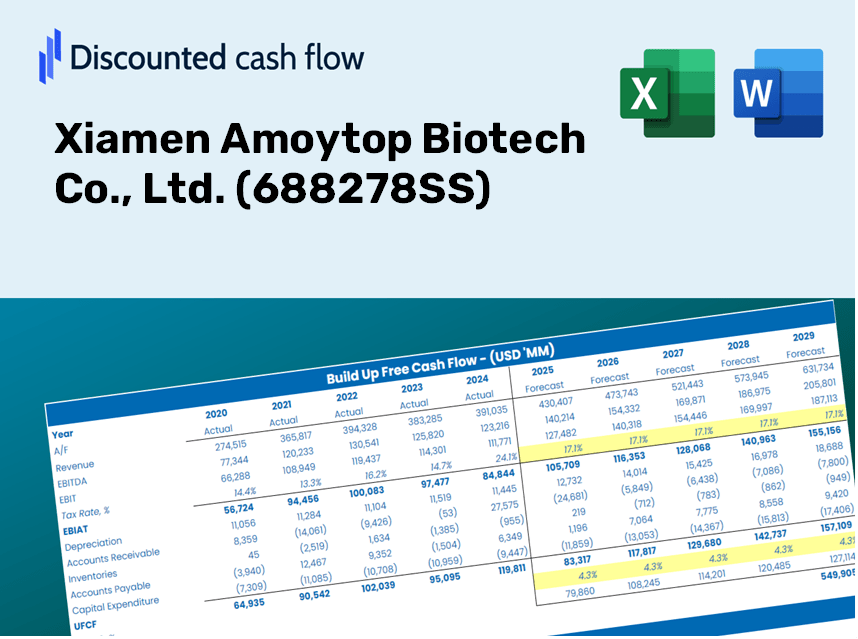
Discounted Cash Flow (DCF) - (USD MM)
| Year | AY1 2020 |
AY2 2021 |
AY3 2022 |
AY4 2023 |
AY5 2024 |
FY1 2025 |
FY2 2026 |
FY3 2027 |
FY4 2028 |
FY5 2029 |
|---|---|---|---|---|---|---|---|---|---|---|
| Revenue | 793.9 | 1,132.2 | 1,526.9 | 2,100.3 | 2,817.2 | 3,867.6 | 5,309.8 | 7,289.7 | 10,007.9 | 13,739.6 |
| Revenue Growth, % | 0 | 42.61 | 34.86 | 37.55 | 34.13 | 37.29 | 37.29 | 37.29 | 37.29 | 37.29 |
| EBITDA | 165.0 | 260.3 | 403.2 | 713.2 | 989.7 | 1,077.4 | 1,479.1 | 2,030.6 | 2,787.8 | 3,827.3 |
| EBITDA, % | 20.79 | 22.99 | 26.41 | 33.96 | 35.13 | 27.86 | 27.86 | 27.86 | 27.86 | 27.86 |
| Depreciation | 38.2 | 38.7 | 43.2 | 53.4 | 59.4 | 121.4 | 166.7 | 228.9 | 314.3 | 431.4 |
| Depreciation, % | 4.81 | 3.42 | 2.83 | 2.54 | 2.11 | 3.14 | 3.14 | 3.14 | 3.14 | 3.14 |
| EBIT | 126.9 | 221.6 | 360.1 | 659.9 | 930.3 | 955.9 | 1,312.3 | 1,801.7 | 2,473.5 | 3,395.8 |
| EBIT, % | 15.98 | 19.58 | 23.58 | 31.42 | 33.02 | 24.72 | 24.72 | 24.72 | 24.72 | 24.72 |
| Total Cash | 465.4 | 481.8 | 572.0 | 670.0 | 661.8 | 1,500.8 | 2,060.5 | 2,828.8 | 3,883.6 | 5,331.7 |
| Total Cash, percent | .0 | .0 | .0 | .0 | .0 | .0 | .0 | .0 | .0 | .0 |
| Account Receivables | 185.0 | 227.9 | 243.2 | 459.7 | 830.5 | 856.5 | 1,175.8 | 1,614.3 | 2,216.2 | 3,042.6 |
| Account Receivables, % | 23.3 | 20.13 | 15.93 | 21.89 | 29.48 | 22.14 | 22.14 | 22.14 | 22.14 | 22.14 |
| Inventories | 99.6 | 116.5 | 129.7 | 187.0 | 263.5 | 383.6 | 526.6 | 723.0 | 992.6 | 1,362.7 |
| Inventories, % | 12.55 | 10.29 | 8.5 | 8.9 | 9.36 | 9.92 | 9.92 | 9.92 | 9.92 | 9.92 |
| Accounts Payable | 18.9 | 39.3 | 97.3 | 40.6 | 60.1 | 126.0 | 173.0 | 237.6 | 326.1 | 447.7 |
| Accounts Payable, % | 2.38 | 3.47 | 6.38 | 1.93 | 2.13 | 3.26 | 3.26 | 3.26 | 3.26 | 3.26 |
| Capital Expenditure | -118.8 | -190.9 | -219.2 | -288.5 | -251.4 | -532.5 | -731.0 | -1,003.6 | -1,377.8 | -1,891.6 |
| Capital Expenditure, % | -14.96 | -16.86 | -14.35 | -13.73 | -8.92 | -13.77 | -13.77 | -13.77 | -13.77 | -13.77 |
| Tax Rate, % | 11.11 | 11.11 | 11.11 | 11.11 | 11.11 | 11.11 | 11.11 | 11.11 | 11.11 | 11.11 |
| EBITAT | 106.3 | 186.5 | 290.4 | 572.1 | 827.0 | 811.0 | 1,113.4 | 1,528.6 | 2,098.6 | 2,881.2 |
| Depreciation | ||||||||||
| Changes in Account Receivables | ||||||||||
| Changes in Inventories | ||||||||||
| Changes in Accounts Payable | ||||||||||
| Capital Expenditure | ||||||||||
| UFCF | -240.0 | -5.1 | 143.9 | 6.4 | 207.2 | 319.9 | 133.7 | 183.6 | 252.1 | 346.1 |
| WACC, % | 4.69 | 4.69 | 4.69 | 4.69 | 4.69 | 4.69 | 4.69 | 4.69 | 4.69 | 4.69 |
| PV UFCF | ||||||||||
| SUM PV UFCF | 1,072.8 | |||||||||
| Long Term Growth Rate, % | 3.50 | |||||||||
| Free cash flow (T + 1) | 358 | |||||||||
| Terminal Value | 30,221 | |||||||||
| Present Terminal Value | 24,037 | |||||||||
| Enterprise Value | 25,110 | |||||||||
| Net Debt | -369 | |||||||||
| Equity Value | 25,478 | |||||||||
| Diluted Shares Outstanding, MM | 408 | |||||||||
| Equity Value Per Share | 62.50 |
Benefits You Will Receive
- Pre-Loaded Financial Model: Xiamen Amoytop Biotech's actual data allows for accurate DCF valuation.
- Comprehensive Forecast Control: Modify revenue growth, profit margins, WACC, and other essential factors.
- Real-Time Calculations: Automatic updates ensure you view results immediately as you adjust parameters.
- Professional-Grade Template: A polished Excel file crafted for high-quality valuation presentations.
- Adaptable and Reusable: Designed for flexibility, enabling consistent use for thorough forecasting.
Key Features
- Comprehensive DCF Model: Features both unlevered and levered Discounted Cash Flow valuation frameworks.
- WACC Tool: Pre-configured Weighted Average Cost of Capital template with adjustable parameters.
- Customizable Forecast Inputs: Easily alter growth projections, capital investments, and discount rates.
- Integrated Financial Ratios: Evaluate profitability, leverage, and efficiency ratios specifically for Xiamen Amoytop Biotech Co., Ltd. (688278SS).
- Visual Dashboard and Charts: Graphical representations display vital valuation metrics for straightforward analysis.
How It Works
- Step 1: Download the prebuilt Excel template featuring data from Xiamen Amoytop Biotech Co., Ltd. (688278SS).
- Step 2: Review the pre-filled sheets to familiarize yourself with the essential metrics.
- Step 3: Modify forecasts and assumptions in the editable yellow cells (WACC, growth, margins).
- Step 4: Instantly see the recalculated results, including the intrinsic value of Xiamen Amoytop Biotech Co., Ltd. (688278SS).
- Step 5: Utilize the outputs to make informed investment decisions or generate detailed reports.
Why Choose Xiamen Amoytop Biotech Co., Ltd. (688278SS) Calculator?
- Precise Financial Insights: Trustworthy data from Xiamen Amoytop ensures accurate valuation outcomes.
- Fully Customizable: Tailor essential variables such as growth forecasts, WACC, and tax rates to align with your expectations.
- Efficiency Boost: Built-in calculations save you time by eliminating the need for a fresh start.
- Professional Quality: Crafted for investors, analysts, and consultants in the biotech industry.
- Easy to Use: Friendly interface and straightforward guidance make it accessible for all users.
Who Can Benefit from Xiamen Amoytop Biotech Co., Ltd. (688278SS)?
- Investors: Gain confidence in your investment choices with our expert valuation resources.
- Financial Analysts: Streamline your workflow with our customizable DCF models designed for efficiency.
- Consultants: Easily modify our templates for impactful client presentations and reports.
- Biotech Enthusiasts: Enhance your knowledge of valuation methods using applicable industry examples.
- Academics and Students: Leverage our tools as a hands-on resource in biotech finance education.
Contents of the Template
- Operating and Balance Sheet Data: Pre-filled historical data and forecasts for Xiamen Amoytop Biotech Co., Ltd. (688278SS), including revenue, EBITDA, EBIT, and capital expenditures.
- WACC Calculation: A dedicated sheet for calculating the Weighted Average Cost of Capital (WACC), featuring parameters such as Beta, risk-free rate, and share price.
- DCF Valuation (Unlevered and Levered): Customizable Discounted Cash Flow models that present intrinsic value with comprehensive calculations.
- Financial Statements: Pre-loaded annual and quarterly financial statements to facilitate in-depth analysis.
- Key Ratios: Includes various profitability, leverage, and efficiency ratios specific to Xiamen Amoytop Biotech Co., Ltd. (688278SS).
- Dashboard and Charts: A visual summary of valuation results and assumptions for straightforward result analysis.
Disclaimer
All information, articles, and product details provided on this website are for general informational and educational purposes only. We do not claim any ownership over, nor do we intend to infringe upon, any trademarks, copyrights, logos, brand names, or other intellectual property mentioned or depicted on this site. Such intellectual property remains the property of its respective owners, and any references here are made solely for identification or informational purposes, without implying any affiliation, endorsement, or partnership.
We make no representations or warranties, express or implied, regarding the accuracy, completeness, or suitability of any content or products presented. Nothing on this website should be construed as legal, tax, investment, financial, medical, or other professional advice. In addition, no part of this site—including articles or product references—constitutes a solicitation, recommendation, endorsement, advertisement, or offer to buy or sell any securities, franchises, or other financial instruments, particularly in jurisdictions where such activity would be unlawful.
All content is of a general nature and may not address the specific circumstances of any individual or entity. It is not a substitute for professional advice or services. Any actions you take based on the information provided here are strictly at your own risk. You accept full responsibility for any decisions or outcomes arising from your use of this website and agree to release us from any liability in connection with your use of, or reliance upon, the content or products found herein.