
|
Sinocelltech Group Limited (688520.SS) Avaliação DCF |
Totalmente Editável: Adapte-Se Às Suas Necessidades No Excel Ou Planilhas
Design Profissional: Modelos Confiáveis E Padrão Da Indústria
Pré-Construídos Para Uso Rápido E Eficiente
Compatível com MAC/PC, totalmente desbloqueado
Não É Necessária Experiência; Fácil De Seguir
Sinocelltech Group Limited (688520.SS) Bundle
Atualize sua análise e melhore a precisão com a calculadora DCF (688520SS)! Equipado com dados autênticos do SinocellTech Group Limited Data and Customizable Pressions, essa ferramenta capacita você a prever, analisar e valorizar (688520ss), assim como um investidor experiente.
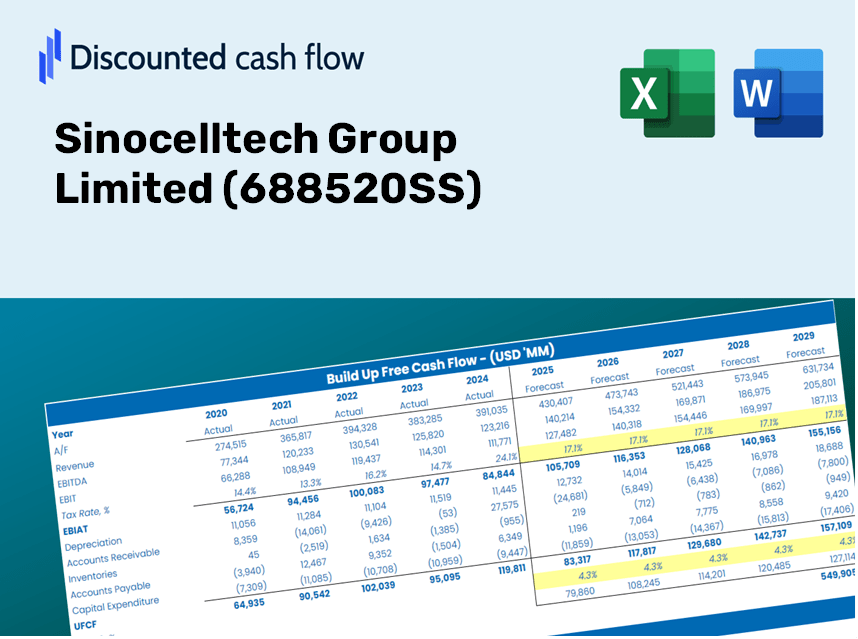
Discounted Cash Flow (DCF) - (USD MM)
| Year | AY1 2020 |
AY2 2021 |
AY3 2022 |
AY4 2023 |
AY5 2024 |
FY1 2025 |
FY2 2026 |
FY3 2027 |
FY4 2028 |
FY5 2029 |
|---|---|---|---|---|---|---|---|---|---|---|
| Revenue | .3 | 134.4 | 1,023.2 | 1,887.3 | 2,512.7 | 4,507.8 | 8,086.9 | 14,507.7 | 26,026.6 | 46,691.3 |
| Revenue Growth, % | 0 | 40852.82 | 661.33 | 84.46 | 33.13 | 79.4 | 79.4 | 79.4 | 79.4 | 79.4 |
| EBITDA | -714.2 | -814.6 | -248.2 | 137.0 | 709.9 | -1,701.7 | -3,052.8 | -5,476.7 | -9,825.2 | -17,626.2 |
| EBITDA, % | -217647.88 | -606.12 | -24.26 | 7.26 | 28.25 | -37.75 | -37.75 | -37.75 | -37.75 | -37.75 |
| Depreciation | 40.0 | 44.2 | 56.8 | 94.5 | 122.0 | 1,337.3 | 2,399.2 | 4,304.0 | 7,721.4 | 13,852.1 |
| Depreciation, % | 12175.27 | 32.92 | 5.55 | 5 | 4.86 | 29.67 | 29.67 | 29.67 | 29.67 | 29.67 |
| EBIT | -754.2 | -858.8 | -305.1 | 42.5 | 587.9 | -1,840.7 | -3,302.1 | -5,923.9 | -10,627.5 | -19,065.5 |
| EBIT, % | -229823.15 | -639.04 | -29.82 | 2.25 | 23.4 | -40.83 | -40.83 | -40.83 | -40.83 | -40.83 |
| Total Cash | 950.3 | 349.5 | 971.9 | 293.4 | 314.9 | 2,912.6 | 5,225.2 | 9,373.9 | 16,816.5 | 30,168.6 |
| Total Cash, percent | .3 | .0 | .0 | .0 | .0 | .0 | .0 | .0 | .0 | .0 |
| Account Receivables | 8.2 | 85.3 | 278.0 | 459.5 | 745.6 | 2,205.9 | 3,957.4 | 7,099.5 | 12,736.5 | 22,849.1 |
| Account Receivables, % | 2510.53 | 63.5 | 27.17 | 24.34 | 29.67 | 48.94 | 48.94 | 48.94 | 48.94 | 48.94 |
| Inventories | 39.2 | 89.8 | 191.9 | 202.7 | 259.5 | 1,862.9 | 3,342.1 | 5,995.7 | 10,756.2 | 19,296.4 |
| Inventories, % | 11947.71 | 66.82 | 18.75 | 10.74 | 10.33 | 41.33 | 41.33 | 41.33 | 41.33 | 41.33 |
| Accounts Payable | 139.5 | 134.6 | 188.7 | 115.9 | 126.6 | 2,070.1 | 3,713.8 | 6,662.5 | 11,952.5 | 21,442.6 |
| Accounts Payable, % | 42521.12 | 100.13 | 18.44 | 6.14 | 5.04 | 45.92 | 45.92 | 45.92 | 45.92 | 45.92 |
| Capital Expenditure | -117.3 | -193.9 | -554.8 | -505.4 | -375.6 | -2,668.1 | -4,786.6 | -8,587.1 | -15,405.1 | -27,636.6 |
| Capital Expenditure, % | -35732.91 | -144.25 | -54.22 | -26.78 | -14.95 | -59.19 | -59.19 | -59.19 | -59.19 | -59.19 |
| Tax Rate, % | 0.35413 | 0.35413 | 0.35413 | 0.35413 | 0.35413 | 0.35413 | 0.35413 | 0.35413 | 0.35413 | 0.35413 |
| EBITAT | -752.6 | -856.8 | -304.4 | 42.4 | 585.8 | -1,836.2 | -3,294.1 | -5,909.6 | -10,601.7 | -19,019.3 |
| Depreciation | ||||||||||
| Changes in Account Receivables | ||||||||||
| Changes in Inventories | ||||||||||
| Changes in Accounts Payable | ||||||||||
| Capital Expenditure | ||||||||||
| UFCF | -737.8 | -1,139.1 | -1,043.0 | -633.6 | .0 | -4,287.2 | -7,268.5 | -13,039.6 | -23,392.9 | -41,966.5 |
| WACC, % | 7.67 | 7.67 | 7.67 | 7.67 | 7.67 | 7.67 | 7.67 | 7.67 | 7.67 | 7.67 |
| PV UFCF | ||||||||||
| SUM PV UFCF | -67,111.4 | |||||||||
| Long Term Growth Rate, % | 2.00 | |||||||||
| Free cash flow (T + 1) | -42,806 | |||||||||
| Terminal Value | -755,206 | |||||||||
| Present Terminal Value | -521,952 | |||||||||
| Enterprise Value | -589,063 | |||||||||
| Net Debt | 1,709 | |||||||||
| Equity Value | -590,772 | |||||||||
| Diluted Shares Outstanding, MM | 466 | |||||||||
| Equity Value Per Share | -1,266.49 |
What You Will Receive
- Flexible Forecast Inputs: Effortlessly adjust assumptions (growth %, margins, WACC) to explore various scenarios.
- Actual Financial Data: Sinocelltech Group Limited's financial information pre-loaded to facilitate your analysis.
- Automated DCF Outputs: The template computes Net Present Value (NPV) and intrinsic value automatically.
- Customizable and Professional Design: A refined Excel model that caters to your valuation requirements.
- Designed for Analysts and Investors: Perfect for evaluating projections, confirming strategies, and enhancing efficiency.
Key Features
- Accurate Financial Data for Sinocelltech: Gain access to reliable historical data and forecasts tailored for Sinocelltech Group Limited (688520SS).
- Flexible Forecast Assumptions: Modify highlighted fields such as WACC, growth rates, and profit margins to suit your analysis.
- Automated Calculations: Instant updates for DCF, Net Present Value (NPV), and cash flow assessments.
- User-Friendly Dashboard: Visually engaging charts and summaries to easily interpret your valuation findings.
- Designed for All Experience Levels: An intuitive layout crafted for investors, CFOs, and consultants alike.
How It Works
- Step 1: Download the prebuilt Excel template featuring Sinocelltech's data.
- Step 2: Review the pre-filled sheets to familiarize yourself with the essential metrics.
- Step 3: Modify forecasts and assumptions in the editable yellow cells (WACC, growth, margins).
- Step 4: Instantly see updated results, including Sinocelltech's intrinsic value.
- Step 5: Use the outputs to make informed investment decisions or create reports.
Why Choose This Calculator for Sinocelltech Group Limited (688520SS)?
- Accurate Data: Access to reliable financials for Sinocelltech ensures trustworthy valuation results.
- Customizable: Tailor key parameters such as growth rates, WACC, and tax rates to align with your predictions.
- Time-Saving: Ready-to-use calculations save you from building models from the ground up.
- Professional-Grade Tool: Specifically crafted for investors, analysts, and consultants in the biotech sector.
- User-Friendly: A clear layout and guided instructions make it accessible for users of all experience levels.
Who Should Consider Using This Product?
- Finance Students: Master valuation methods and practice with real-world data related to Sinocelltech Group Limited (688520SS).
- Researchers: Integrate established financial models into your academic work or studies.
- Investors: Evaluate your own hypotheses and assess valuation results for Sinocelltech Group Limited (688520SS).
- Financial Analysts: Enhance your efficiency with a ready-made, adaptable DCF model designed for Sinocelltech Group Limited (688520SS).
- Entrepreneurs: Discover how large public entities like Sinocelltech Group Limited (688520SS) are evaluated in the market.
Contents of the Template
- Pre-Filled Data: Features Sinocelltech Group Limited's historical financials and projections.
- Discounted Cash Flow Model: Editable DCF valuation model with automatic computations.
- Weighted Average Cost of Capital (WACC): A dedicated sheet for calculating WACC using custom parameters.
- Key Financial Ratios: Assess Sinocelltech's profitability, efficiency, and financial leverage.
- Customizable Inputs: Easily adjust revenue growth, profit margins, and tax rates.
- Clear Dashboard: Visual representations and tables summarizing essential valuation outcomes.
Disclaimer
All information, articles, and product details provided on this website are for general informational and educational purposes only. We do not claim any ownership over, nor do we intend to infringe upon, any trademarks, copyrights, logos, brand names, or other intellectual property mentioned or depicted on this site. Such intellectual property remains the property of its respective owners, and any references here are made solely for identification or informational purposes, without implying any affiliation, endorsement, or partnership.
We make no representations or warranties, express or implied, regarding the accuracy, completeness, or suitability of any content or products presented. Nothing on this website should be construed as legal, tax, investment, financial, medical, or other professional advice. In addition, no part of this site—including articles or product references—constitutes a solicitation, recommendation, endorsement, advertisement, or offer to buy or sell any securities, franchises, or other financial instruments, particularly in jurisdictions where such activity would be unlawful.
All content is of a general nature and may not address the specific circumstances of any individual or entity. It is not a substitute for professional advice or services. Any actions you take based on the information provided here are strictly at your own risk. You accept full responsibility for any decisions or outcomes arising from your use of this website and agree to release us from any liability in connection with your use of, or reliance upon, the content or products found herein.