
|
Sichuan Huiyu Pharmaceutical Co., Ltd. (688553.SS) Avaliação DCF |
Totalmente Editável: Adapte-Se Às Suas Necessidades No Excel Ou Planilhas
Design Profissional: Modelos Confiáveis E Padrão Da Indústria
Pré-Construídos Para Uso Rápido E Eficiente
Compatível com MAC/PC, totalmente desbloqueado
Não É Necessária Experiência; Fácil De Seguir
Sichuan Huiyu Pharmaceutical Co., Ltd. (688553.SS) Bundle
Obtenha informações sobre sua análise de avaliação Sichuan Huiyu Pharmaceutical Co., Ltd. (688553Ss) usando nossa sofisticada calculadora DCF! Pré -carregado com dados reais (688553Ss), este modelo do Excel permite ajustar as previsões e suposições para determinar com precisão o valor intrínseco de Sichuan Huiyu Pharmaceutical Co., Ltd.
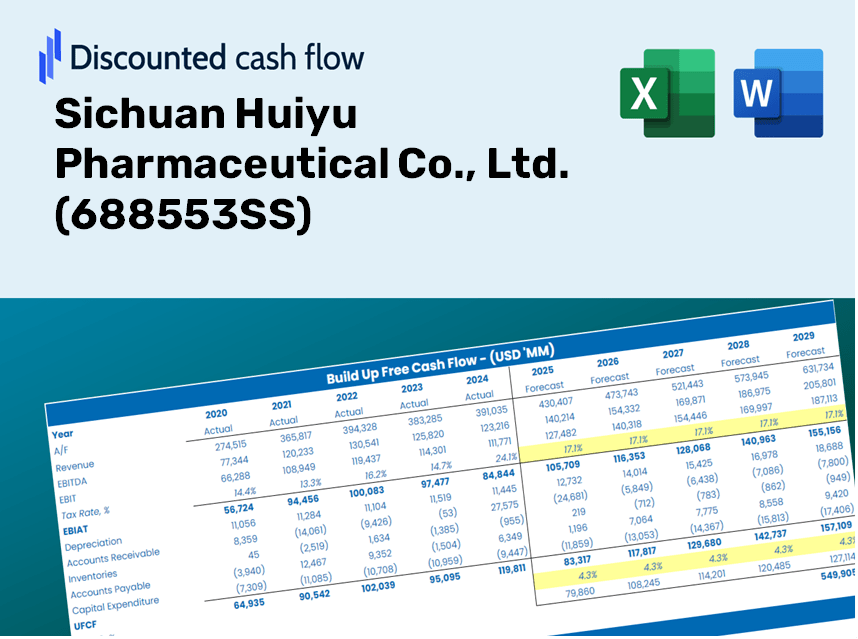
Discounted Cash Flow (DCF) - (USD MM)
| Year | AY1 2020 |
AY2 2021 |
AY3 2022 |
AY4 2023 |
AY5 2024 |
FY1 2025 |
FY2 2026 |
FY3 2027 |
FY4 2028 |
FY5 2029 |
|---|---|---|---|---|---|---|---|---|---|---|
| Revenue | 1,364.2 | 1,823.7 | 1,493.3 | 927.1 | 1,094.4 | 1,513.4 | 2,092.7 | 2,893.9 | 4,001.9 | 5,534.0 |
| Revenue Growth, % | 0 | 33.69 | -18.12 | -37.92 | 18.05 | 38.28 | 38.28 | 38.28 | 38.28 | 38.28 |
| EBITDA | 402.5 | 468.9 | 184.4 | 65.2 | 137.5 | 263.8 | 364.8 | 504.5 | 697.6 | 964.7 |
| EBITDA, % | 29.5 | 25.71 | 12.35 | 7.03 | 12.56 | 17.43 | 17.43 | 17.43 | 17.43 | 17.43 |
| Depreciation | 24.7 | 35.4 | 47.7 | 58.8 | 76.5 | 61.4 | 84.9 | 117.4 | 162.4 | 224.5 |
| Depreciation, % | 1.81 | 1.94 | 3.2 | 6.34 | 6.99 | 4.06 | 4.06 | 4.06 | 4.06 | 4.06 |
| EBIT | 377.7 | 433.5 | 136.7 | 6.4 | 61.0 | 202.4 | 279.9 | 387.0 | 535.2 | 740.1 |
| EBIT, % | 27.69 | 23.77 | 9.15 | 0.68908 | 5.57 | 13.37 | 13.37 | 13.37 | 13.37 | 13.37 |
| Total Cash | 599.5 | 2,968.0 | 2,581.8 | 2,571.5 | 3,016.8 | 1,343.7 | 1,858.1 | 2,569.5 | 3,553.2 | 4,913.6 |
| Total Cash, percent | .0 | .0 | .0 | .0 | .0 | .0 | .0 | .0 | .0 | .0 |
| Account Receivables | 26.0 | 22.2 | 51.8 | 55.9 | 58.1 | 54.3 | 75.0 | 103.8 | 143.5 | 198.4 |
| Account Receivables, % | 1.91 | 1.22 | 3.47 | 6.03 | 5.31 | 3.59 | 3.59 | 3.59 | 3.59 | 3.59 |
| Inventories | 94.6 | 178.9 | 166.0 | 153.1 | 159.9 | 178.5 | 246.9 | 341.4 | 472.1 | 652.9 |
| Inventories, % | 6.94 | 9.81 | 11.12 | 16.52 | 14.61 | 11.8 | 11.8 | 11.8 | 11.8 | 11.8 |
| Accounts Payable | 29.5 | 59.2 | 95.5 | 133.9 | 197.0 | 133.9 | 185.2 | 256.1 | 354.2 | 489.8 |
| Accounts Payable, % | 2.16 | 3.25 | 6.4 | 14.44 | 18 | 8.85 | 8.85 | 8.85 | 8.85 | 8.85 |
| Capital Expenditure | -158.2 | -433.5 | -461.6 | -296.7 | -128.2 | -332.9 | -460.4 | -636.7 | -880.4 | -1,217.5 |
| Capital Expenditure, % | -11.6 | -23.77 | -30.91 | -32.01 | -11.71 | -22 | -22 | -22 | -22 | -22 |
| Tax Rate, % | 6.95 | 6.95 | 6.95 | 6.95 | 6.95 | 6.95 | 6.95 | 6.95 | 6.95 | 6.95 |
| EBITAT | 327.1 | 404.6 | 142.7 | 6.8 | 56.7 | 191.5 | 264.8 | 366.1 | 506.3 | 700.1 |
| Depreciation | ||||||||||
| Changes in Account Receivables | ||||||||||
| Changes in Inventories | ||||||||||
| Changes in Accounts Payable | ||||||||||
| Capital Expenditure | ||||||||||
| UFCF | 102.5 | -44.1 | -251.6 | -184.1 | 59.3 | -158.0 | -148.6 | -205.5 | -284.1 | -392.9 |
| WACC, % | 5.35 | 5.37 | 5.38 | 5.38 | 5.37 | 5.37 | 5.37 | 5.37 | 5.37 | 5.37 |
| PV UFCF | ||||||||||
| SUM PV UFCF | -992.3 | |||||||||
| Long Term Growth Rate, % | 2.00 | |||||||||
| Free cash flow (T + 1) | -401 | |||||||||
| Terminal Value | -11,894 | |||||||||
| Present Terminal Value | -9,157 | |||||||||
| Enterprise Value | -10,150 | |||||||||
| Net Debt | -1,748 | |||||||||
| Equity Value | -8,402 | |||||||||
| Diluted Shares Outstanding, MM | 423 | |||||||||
| Equity Value Per Share | -19.88 |
Benefits You Will Receive
- Customizable Forecast Inputs: Effortlessly adjust parameters (growth %, margins, WACC) to explore different scenarios.
- Pre-filled Industry Data: Access Sichuan Huiyu Pharmaceutical’s financial information to kickstart your analysis.
- Instant DCF Calculations: The template automatically computes Net Present Value (NPV) and intrinsic value for your convenience.
- Professional and Adaptable: A sleek Excel model tailored to meet your valuation requirements.
- Designed for Analysts and Investors: Perfect for evaluating forecasts, assessing strategies, and enhancing efficiency.
Key Features
- Comprehensive DCF Calculator: Offers detailed unlevered and levered DCF valuation models tailored for Sichuan Huiyu Pharmaceutical Co., Ltd. (688553SS).
- WACC Calculator: Features a pre-built Weighted Average Cost of Capital sheet with customizable inputs specific to the pharmaceutical sector.
- Customizable Forecast Assumptions: Adjust growth rates, capital expenditures, and discount rates to fit your analysis needs.
- Integrated Financial Ratios: Evaluate profitability, leverage, and efficiency ratios relevant to Sichuan Huiyu Pharmaceutical Co., Ltd. (688553SS).
- Interactive Dashboard and Charts: Visual representations provide a summary of key valuation metrics for enhanced analysis.
Process Overview
- Step 1: Download the comprehensive Excel template featuring Sichuan Huiyu Pharmaceutical Co., Ltd.'s (688553SS) data.
- Step 2: Review the pre-populated sheets to familiarize yourself with the essential metrics.
- Step 3: Modify forecasts and assumptions in the editable yellow cells (WACC, growth, margins).
- Step 4: Instantly access updated results, including Sichuan Huiyu Pharmaceutical Co., Ltd.'s (688553SS) intrinsic value.
- Step 5: Utilize the outputs to make informed investment choices or create detailed reports.
Why Choose This Calculator for Sichuan Huiyu Pharmaceutical Co., Ltd. (688553SS)?
- All-in-One Solution: Combines DCF, WACC, and various financial ratio analyses into a single tool.
- Flexible Inputs: Modify the yellow-highlighted cells to explore a range of scenarios.
- In-Depth Analysis: Automatically computes the intrinsic value and Net Present Value for Sichuan Huiyu Pharmaceutical.
- Built-in Data: Historical and projected figures provide reliable starting points for assessment.
- High-Quality Standards: Perfect for financial analysts, investors, and business consultants focused on the pharmaceutical sector.
Who Can Benefit from This Product?
- Investors: Accurately assess the fair value of Sichuan Huiyu Pharmaceutical Co., Ltd. (688553SS) prior to making investment choices.
- CFOs: Utilize a high-caliber DCF model for financial analysis and reporting.
- Consultants: Easily modify the template for developing valuation reports tailored to client needs.
- Entrepreneurs: Acquire insights into financial modeling practices employed by leading pharmaceutical firms.
- Educators: Implement it as an educational resource to illustrate various valuation techniques.
What the Template Contains
- Historical Data: Provides Sichuan Huiyu Pharmaceutical Co., Ltd.’s past financial performance and foundational forecasts.
- DCF and Levered DCF Models: Comprehensive templates designed to assess the intrinsic value of Sichuan Huiyu Pharmaceutical Co., Ltd. (688553SS).
- WACC Sheet: Pre-configured calculations for the Weighted Average Cost of Capital.
- Editable Inputs: Customize essential drivers such as growth rates, EBITDA %, and CAPEX assumptions.
- Quarterly and Annual Statements: An in-depth analysis of Sichuan Huiyu Pharmaceutical Co., Ltd.’s financial statements.
- Interactive Dashboard: Dynamic visual representation of valuation outcomes and projections.
Disclaimer
All information, articles, and product details provided on this website are for general informational and educational purposes only. We do not claim any ownership over, nor do we intend to infringe upon, any trademarks, copyrights, logos, brand names, or other intellectual property mentioned or depicted on this site. Such intellectual property remains the property of its respective owners, and any references here are made solely for identification or informational purposes, without implying any affiliation, endorsement, or partnership.
We make no representations or warranties, express or implied, regarding the accuracy, completeness, or suitability of any content or products presented. Nothing on this website should be construed as legal, tax, investment, financial, medical, or other professional advice. In addition, no part of this site—including articles or product references—constitutes a solicitation, recommendation, endorsement, advertisement, or offer to buy or sell any securities, franchises, or other financial instruments, particularly in jurisdictions where such activity would be unlawful.
All content is of a general nature and may not address the specific circumstances of any individual or entity. It is not a substitute for professional advice or services. Any actions you take based on the information provided here are strictly at your own risk. You accept full responsibility for any decisions or outcomes arising from your use of this website and agree to release us from any liability in connection with your use of, or reliance upon, the content or products found herein.