
|
Shanghai Gentech Co., Ltd. (688596.SS) Avaliação DCF |
Totalmente Editável: Adapte-Se Às Suas Necessidades No Excel Ou Planilhas
Design Profissional: Modelos Confiáveis E Padrão Da Indústria
Pré-Construídos Para Uso Rápido E Eficiente
Compatível com MAC/PC, totalmente desbloqueado
Não É Necessária Experiência; Fácil De Seguir
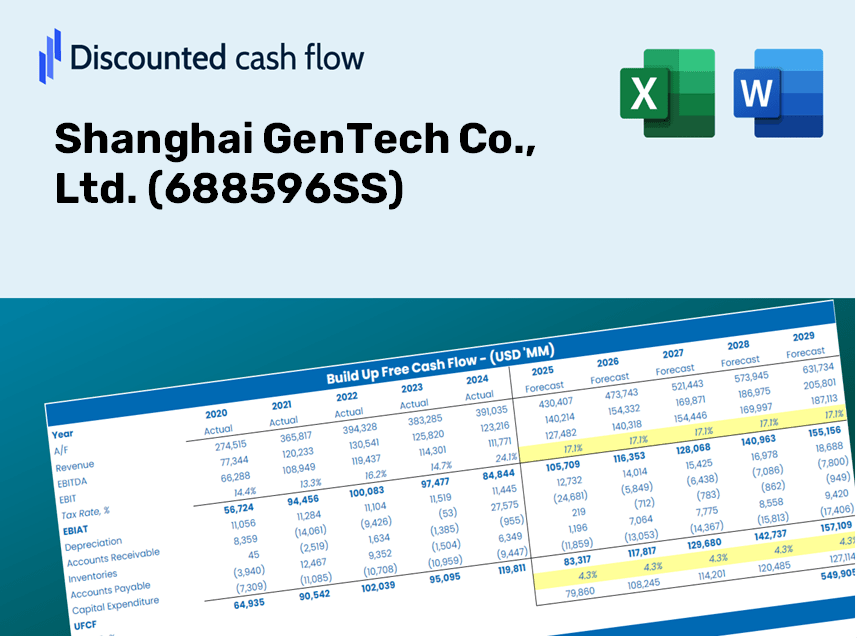
Shanghai GenTech Co., Ltd. (688596.SS) Bundle
Explore o potencial financeiro da Shanghai Gentech Co., Ltd. (688596Ss) com nossa calculadora DCF amigável! Digite suas suposições de crescimento, margens e custos para calcular o valor intrínseco da Shanghai Gentech Co., Ltd. (688596Ss) e refine sua estratégia de investimento.
Discounted Cash Flow (DCF) - (USD MM)
| Year | AY1 2020 |
AY2 2021 |
AY3 2022 |
AY4 2023 |
AY5 2024 |
FY1 2025 |
FY2 2026 |
FY3 2027 |
FY4 2028 |
FY5 2029 |
|---|---|---|---|---|---|---|---|---|---|---|
| Revenue | 1,109.0 | 1,836.8 | 2,704.7 | 3,834.7 | 5,469.3 | 8,166.9 | 12,194.9 | 18,209.6 | 27,190.9 | 40,601.9 |
| Revenue Growth, % | 0 | 65.63 | 47.26 | 41.78 | 42.63 | 49.32 | 49.32 | 49.32 | 49.32 | 49.32 |
| EBITDA | 128.1 | 181.0 | 270.4 | 440.4 | 663.7 | 898.7 | 1,341.9 | 2,003.8 | 2,992.0 | 4,467.8 |
| EBITDA, % | 11.55 | 9.86 | 10 | 11.48 | 12.14 | 11 | 11 | 11 | 11 | 11 |
| Depreciation | 33.2 | 34.7 | 42.7 | 60.2 | 85.5 | 156.7 | 234.1 | 349.5 | 521.9 | 779.2 |
| Depreciation, % | 3 | 1.89 | 1.58 | 1.57 | 1.56 | 1.92 | 1.92 | 1.92 | 1.92 | 1.92 |
| EBIT | 94.8 | 146.4 | 227.7 | 380.2 | 578.2 | 741.9 | 1,107.9 | 1,654.3 | 2,470.2 | 3,688.5 |
| EBIT, % | 8.55 | 7.97 | 8.42 | 9.91 | 10.57 | 9.08 | 9.08 | 9.08 | 9.08 | 9.08 |
| Total Cash | 882.4 | 640.9 | 1,253.9 | 635.6 | 1,179.4 | 3,249.8 | 4,852.6 | 7,246.0 | 10,819.8 | 16,156.3 |
| Total Cash, percent | .0 | .0 | .0 | .0 | .0 | .0 | .0 | .0 | .0 | .0 |
| Account Receivables | 728.6 | 829.5 | 1,239.1 | 2,135.5 | 2,277.7 | 4,148.9 | 6,195.2 | 9,250.7 | 13,813.3 | 20,626.3 |
| Account Receivables, % | 65.7 | 45.16 | 45.81 | 55.69 | 41.64 | 50.8 | 50.8 | 50.8 | 50.8 | 50.8 |
| Inventories | 638.8 | 1,062.1 | 1,983.4 | 3,376.6 | 2,971.8 | 5,408.9 | 8,076.7 | 12,060.2 | 18,008.5 | 26,890.6 |
| Inventories, % | 57.61 | 57.82 | 73.33 | 88.05 | 54.34 | 66.23 | 66.23 | 66.23 | 66.23 | 66.23 |
| Accounts Payable | 483.9 | 653.7 | 987.5 | 1,848.0 | 2,097.5 | 3,304.0 | 4,933.5 | 7,366.8 | 11,000.3 | 16,425.8 |
| Accounts Payable, % | 43.64 | 35.59 | 36.51 | 48.19 | 38.35 | 40.46 | 40.46 | 40.46 | 40.46 | 40.46 |
| Capital Expenditure | -29.1 | -187.2 | -259.6 | -360.2 | -424.0 | -646.2 | -964.9 | -1,440.8 | -2,151.4 | -3,212.5 |
| Capital Expenditure, % | -2.63 | -10.19 | -9.6 | -9.39 | -7.75 | -7.91 | -7.91 | -7.91 | -7.91 | -7.91 |
| Tax Rate, % | 10.49 | 10.49 | 10.49 | 10.49 | 10.49 | 10.49 | 10.49 | 10.49 | 10.49 | 10.49 |
| EBITAT | 82.5 | 134.4 | 219.9 | 346.3 | 517.5 | 676.6 | 1,010.3 | 1,508.7 | 2,252.8 | 3,363.9 |
| Depreciation | ||||||||||
| Changes in Account Receivables | ||||||||||
| Changes in Inventories | ||||||||||
| Changes in Accounts Payable | ||||||||||
| Capital Expenditure | ||||||||||
| UFCF | -797.0 | -372.4 | -994.2 | -1,382.8 | 691.1 | -2,914.6 | -2,805.0 | -4,188.4 | -6,254.2 | -9,338.9 |
| WACC, % | 4.53 | 4.55 | 4.57 | 4.55 | 4.54 | 4.55 | 4.55 | 4.55 | 4.55 | 4.55 |
| PV UFCF | ||||||||||
| SUM PV UFCF | -21,732.1 | |||||||||
| Long Term Growth Rate, % | 4.00 | |||||||||
| Free cash flow (T + 1) | -9,712 | |||||||||
| Terminal Value | -1,776,521 | |||||||||
| Present Terminal Value | -1,422,389 | |||||||||
| Enterprise Value | -1,444,121 | |||||||||
| Net Debt | -168 | |||||||||
| Equity Value | -1,443,953 | |||||||||
| Diluted Shares Outstanding, MM | 284 | |||||||||
| Equity Value Per Share | -5,089.08 |
What You Will Receive
- Comprehensive Financial Model: Leverage Shanghai GenTech Co., Ltd.'s (688596SS) actual data for accurate DCF valuations.
- Full Customization Control: Modify revenue growth rates, profit margins, WACC, and other essential parameters to fit your analysis.
- Real-Time Calculations: Instant updates ensure you can view results dynamically as adjustments are made.
- Professional-Grade Template: A polished Excel document crafted for high-quality valuation presentations.
- Flexible and Reusable: Designed for adaptability, making it suitable for repeated use in detailed financial forecasts.
Key Features
- Authentic Shanghai GenTech Data: Pre-populated with the company’s historical performance metrics and forward-looking estimates.
- Comprehensive Customization Options: Modify revenue growth rates, profit margins, discount rates, tax implications, and capital investments.
- Interactive Valuation Model: Automatically recalibrates Net Present Value (NPV) and intrinsic value in response to your adjustments.
- Multiple Scenario Analysis: Generate various forecasting scenarios to explore different valuation possibilities.
- Intuitive User Interface: User-friendly layout crafted for both seasoned experts and newcomers.
How It Works
- Step 1: Download the prebuilt Excel template featuring Shanghai GenTech Co., Ltd.'s (688596SS) data.
- Step 2: Review the pre-filled sheets to familiarize yourself with the key performance indicators.
- Step 3: Update the forecasts and assumptions in the editable yellow cells (WACC, growth rates, profit margins).
- Step 4: Instantly see the recalculated results, including the intrinsic value of Shanghai GenTech Co., Ltd. (688596SS).
- Step 5: Use the output data to make well-informed investment decisions or create detailed reports.
Why Opt for Shanghai GenTech Co., Ltd. Calculator?
- All-in-One Solution: Features DCF, WACC, and financial ratio assessments conveniently combined.
- Flexible Inputs: Modify the highlighted cells to explore different financial scenarios.
- In-Depth Analysis: Provides automatic calculations of Shanghai GenTech's intrinsic value and Net Present Value.
- Pre-Integrated Data: Comes with both historical and projected data for precise analysis.
- High-Quality Standards: Perfect for financial analysts, investors, and business advisors.
Who Can Benefit from This Product?
- Investors: Evaluate the valuation of Shanghai GenTech Co., Ltd. (688596SS) before making stock trades.
- CFOs and Financial Analysts: Optimize valuation practices and validate financial forecasts.
- Startup Founders: Gain insights into the valuation methods of leading companies like Shanghai GenTech Co., Ltd. (688596SS).
- Consultants: Create detailed valuation reports for your clientele.
- Students and Educators: Utilize real data to learn and teach valuation strategies.
Contents of the Template
- Pre-Filled DCF Model: Shanghai GenTech Co., Ltd.'s financial data preloaded for immediate use.
- WACC Calculator: Comprehensive calculations for Weighted Average Cost of Capital.
- Financial Ratios: Assess Shanghai GenTech's profitability, leverage, and efficiency.
- Editable Inputs: Modify assumptions such as growth rates, margins, and CAPEX to align with your scenarios.
- Financial Statements: Annual and quarterly reports to facilitate thorough analysis.
- Interactive Dashboard: Seamlessly visualize key valuation metrics and outcomes.
Disclaimer
All information, articles, and product details provided on this website are for general informational and educational purposes only. We do not claim any ownership over, nor do we intend to infringe upon, any trademarks, copyrights, logos, brand names, or other intellectual property mentioned or depicted on this site. Such intellectual property remains the property of its respective owners, and any references here are made solely for identification or informational purposes, without implying any affiliation, endorsement, or partnership.
We make no representations or warranties, express or implied, regarding the accuracy, completeness, or suitability of any content or products presented. Nothing on this website should be construed as legal, tax, investment, financial, medical, or other professional advice. In addition, no part of this site—including articles or product references—constitutes a solicitation, recommendation, endorsement, advertisement, or offer to buy or sell any securities, franchises, or other financial instruments, particularly in jurisdictions where such activity would be unlawful.
All content is of a general nature and may not address the specific circumstances of any individual or entity. It is not a substitute for professional advice or services. Any actions you take based on the information provided here are strictly at your own risk. You accept full responsibility for any decisions or outcomes arising from your use of this website and agree to release us from any liability in connection with your use of, or reliance upon, the content or products found herein.