
|
Shanghai Electric Wind Power Group Co., Ltd. (688660.SS) Avaliação DCF |
Totalmente Editável: Adapte-Se Às Suas Necessidades No Excel Ou Planilhas
Design Profissional: Modelos Confiáveis E Padrão Da Indústria
Pré-Construídos Para Uso Rápido E Eficiente
Compatível com MAC/PC, totalmente desbloqueado
Não É Necessária Experiência; Fácil De Seguir
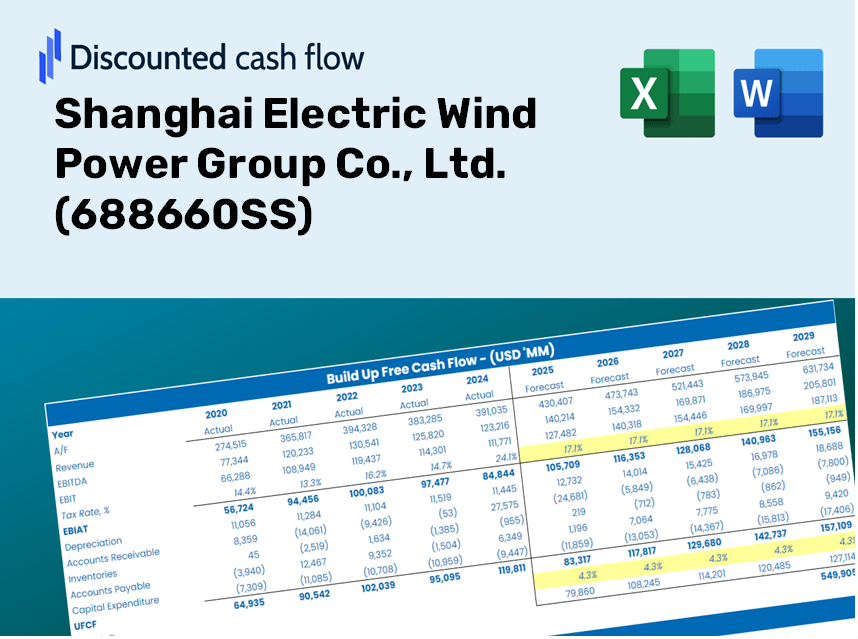
Shanghai Electric Wind Power Group Co., Ltd. (688660.SS) Bundle
Aprimore sua estratégia de investimento com o Shanghai Electric Wind Power Group Co., Ltd. (688660SS) DCF Calculator! Utilize dados financeiros reais, ajuste as projeções e despesas de crescimento e observe instantaneamente como essas mudanças afetam o valor intrínseco do Shanghai Electric Wind Power Group Co., Ltd. (688660Ss).
Discounted Cash Flow (DCF) - (USD MM)
| Year | AY1 2020 |
AY2 2021 |
AY3 2022 |
AY4 2023 |
AY5 2024 |
FY1 2025 |
FY2 2026 |
FY3 2027 |
FY4 2028 |
FY5 2029 |
|---|---|---|---|---|---|---|---|---|---|---|
| Revenue | 20,685.4 | 23,498.0 | 12,075.1 | 10,114.2 | 10,438.0 | 9,184.1 | 8,080.8 | 7,110.0 | 6,255.9 | 5,504.3 |
| Revenue Growth, % | 0 | 13.6 | -48.61 | -16.24 | 3.2 | -12.01 | -12.01 | -12.01 | -12.01 | -12.01 |
| EBITDA | 531.2 | 840.5 | -329.1 | -1,549.9 | -482.5 | -303.6 | -267.1 | -235.0 | -206.8 | -181.9 |
| EBITDA, % | 2.57 | 3.58 | -2.73 | -15.32 | -4.62 | -3.31 | -3.31 | -3.31 | -3.31 | -3.31 |
| Depreciation | 239.2 | 383.2 | 377.0 | 341.1 | 341.4 | 230.6 | 202.9 | 178.5 | 157.1 | 138.2 |
| Depreciation, % | 1.16 | 1.63 | 3.12 | 3.37 | 3.27 | 2.51 | 2.51 | 2.51 | 2.51 | 2.51 |
| EBIT | 292.0 | 457.3 | -706.1 | -1,891.0 | -823.9 | -534.1 | -470.0 | -413.5 | -363.8 | -320.1 |
| EBIT, % | 1.41 | 1.95 | -5.85 | -18.7 | -7.89 | -5.82 | -5.82 | -5.82 | -5.82 | -5.82 |
| Total Cash | 4,076.8 | 6,044.6 | 5,680.1 | 2,210.7 | 3,004.7 | 2,628.8 | 2,313.0 | 2,035.1 | 1,790.6 | 1,575.5 |
| Total Cash, percent | .0 | .0 | .0 | .0 | .0 | .0 | .0 | .0 | .0 | .0 |
| Account Receivables | 12,604.3 | 9,347.6 | 9,633.1 | 9,973.8 | 10,657.3 | 6,963.4 | 6,126.9 | 5,390.8 | 4,743.2 | 4,173.4 |
| Account Receivables, % | 60.93 | 39.78 | 79.78 | 98.61 | 102.1 | 75.82 | 75.82 | 75.82 | 75.82 | 75.82 |
| Inventories | 4,643.6 | 4,156.7 | 1,795.4 | 1,669.0 | 1,712.4 | 1,614.8 | 1,420.8 | 1,250.1 | 1,100.0 | 967.8 |
| Inventories, % | 22.45 | 17.69 | 14.87 | 16.5 | 16.41 | 17.58 | 17.58 | 17.58 | 17.58 | 17.58 |
| Accounts Payable | 13,310.2 | 13,579.6 | 12,375.8 | 10,969.3 | 12,860.2 | 7,753.9 | 6,822.4 | 6,002.8 | 5,281.6 | 4,647.2 |
| Accounts Payable, % | 64.35 | 57.79 | 102.49 | 108.45 | 123.21 | 84.43 | 84.43 | 84.43 | 84.43 | 84.43 |
| Capital Expenditure | -936.5 | -479.5 | -2,061.8 | -1,639.4 | -543.6 | -827.6 | -728.2 | -640.7 | -563.8 | -496.0 |
| Capital Expenditure, % | -4.53 | -2.04 | -17.07 | -16.21 | -5.21 | -9.01 | -9.01 | -9.01 | -9.01 | -9.01 |
| Tax Rate, % | 13 | 13 | 13 | 13 | 13 | 13 | 13 | 13 | 13 | 13 |
| EBITAT | 264.1 | 439.2 | -532.3 | -1,725.5 | -716.8 | -470.2 | -413.7 | -364.0 | -320.3 | -281.8 |
| Depreciation | ||||||||||
| Changes in Account Receivables | ||||||||||
| Changes in Inventories | ||||||||||
| Changes in Accounts Payable | ||||||||||
| Capital Expenditure | ||||||||||
| UFCF | -4,371.0 | 4,355.9 | -1,345.1 | -4,644.5 | 244.9 | -2,382.0 | -840.0 | -739.1 | -650.3 | -572.2 |
| WACC, % | 5.04 | 5.07 | 4.94 | 5.04 | 5.01 | 5.02 | 5.02 | 5.02 | 5.02 | 5.02 |
| PV UFCF | ||||||||||
| SUM PV UFCF | -4,650.4 | |||||||||
| Long Term Growth Rate, % | 4.00 | |||||||||
| Free cash flow (T + 1) | -595 | |||||||||
| Terminal Value | -58,366 | |||||||||
| Present Terminal Value | -45,689 | |||||||||
| Enterprise Value | -50,339 | |||||||||
| Net Debt | -132 | |||||||||
| Equity Value | -50,208 | |||||||||
| Diluted Shares Outstanding, MM | 1,333 | |||||||||
| Equity Value Per Share | -37.66 |
What You Will Gain
- Authentic Shanghai Electric Data: Preloaded financials – covering everything from revenue to EBIT – based on both actual and projected metrics.
- Complete Customization: Modify all essential parameters (yellow cells) such as WACC, growth %, and tax rates with ease.
- Immediate Valuation Adjustments: Automated recalculations to evaluate the effects of changes on Shanghai Electric's fair value.
- Flexible Excel Template: Designed for quick modifications, scenario analysis, and in-depth forecasting.
- Efficient and Precise: Eliminate the hassle of building models from the ground up while ensuring accuracy and versatility.
Key Features
- Pre-Loaded Data: Historical financial statements and pre-filled forecasts for Shanghai Electric Wind Power Group Co., Ltd. (688660SS).
- Fully Adjustable Inputs: Customize WACC, tax rates, revenue growth, and EBITDA margins as needed.
- Instant Results: View the intrinsic value of Shanghai Electric Wind Power Group Co., Ltd. (688660SS) recalculated in real time.
- Clear Visual Outputs: Dashboard charts present valuation outcomes and essential metrics effectively.
- Built for Accuracy: A professional-grade tool designed for analysts, investors, and finance professionals.
How It Works
- Step 1: Download the Excel template.
- Step 2: Examine the pre-filled financial data and projections for Shanghai Electric Wind Power Group Co., Ltd. (688660SS).
- Step 3: Adjust key parameters such as revenue growth, WACC, and tax rates (highlighted cells).
- Step 4: Observe the DCF model update in real-time as you modify your assumptions.
- Step 5: Evaluate the results and leverage the insights for your investment strategies.
Why Choose This Calculator for Shanghai Electric Wind Power Group Co., Ltd. (688660SS)?
- All-In-One Solution: Combines DCF, WACC, and financial ratio analyses for a comprehensive evaluation.
- Flexible Inputs: Modify yellow-highlighted fields to explore different financial scenarios.
- In-Depth Analysis: Automatically computes the intrinsic value and Net Present Value for Shanghai Electric Wind Power Group.
- Data Ready: Features both historical and projected data for precise calculations.
- High-Quality Standards: Perfect for financial analysts, investors, and business consultants specializing in renewable energy.
Who Can Benefit from This Product?
- Investors: Assess the valuation of Shanghai Electric Wind Power Group Co., Ltd. (688660SS) before making investment decisions.
- CFOs and Financial Analysts: Optimize valuation processes and validate financial forecasts.
- Startup Founders: Understand how established companies like Shanghai Electric Wind Power Group Co., Ltd. (688660SS) are valued in the market.
- Consultants: Provide comprehensive valuation reports to your clients.
- Students and Educators: Utilize real-world examples to learn and teach valuation methodologies.
Contents of the Template
- In-Depth DCF Model: Editable template featuring comprehensive valuation calculations.
- Actual Data: Historical and projected financials of Shanghai Electric Wind Power Group Co., Ltd. (688660SS) preloaded for review.
- Flexible Assumptions: Modify WACC, growth rates, and tax parameters to explore various scenarios.
- Financial Statements: Complete annual and quarterly reports for enhanced analysis.
- Essential Ratios: Integrated evaluations for profitability, efficiency, and leverage metrics.
- Visual Dashboard: Charts and tables that present clear and actionable insights.
Disclaimer
All information, articles, and product details provided on this website are for general informational and educational purposes only. We do not claim any ownership over, nor do we intend to infringe upon, any trademarks, copyrights, logos, brand names, or other intellectual property mentioned or depicted on this site. Such intellectual property remains the property of its respective owners, and any references here are made solely for identification or informational purposes, without implying any affiliation, endorsement, or partnership.
We make no representations or warranties, express or implied, regarding the accuracy, completeness, or suitability of any content or products presented. Nothing on this website should be construed as legal, tax, investment, financial, medical, or other professional advice. In addition, no part of this site—including articles or product references—constitutes a solicitation, recommendation, endorsement, advertisement, or offer to buy or sell any securities, franchises, or other financial instruments, particularly in jurisdictions where such activity would be unlawful.
All content is of a general nature and may not address the specific circumstances of any individual or entity. It is not a substitute for professional advice or services. Any actions you take based on the information provided here are strictly at your own risk. You accept full responsibility for any decisions or outcomes arising from your use of this website and agree to release us from any liability in connection with your use of, or reliance upon, the content or products found herein.