
|
Kunshan Dongwei Technology Co., Ltd. (688700.SS) Avaliação do DCF |
Totalmente Editável: Adapte-Se Às Suas Necessidades No Excel Ou Planilhas
Design Profissional: Modelos Confiáveis E Padrão Da Indústria
Pré-Construídos Para Uso Rápido E Eficiente
Compatível com MAC/PC, totalmente desbloqueado
Não É Necessária Experiência; Fácil De Seguir
Kunshan Dongwei Technology Co.,Ltd. (688700.SS) Bundle
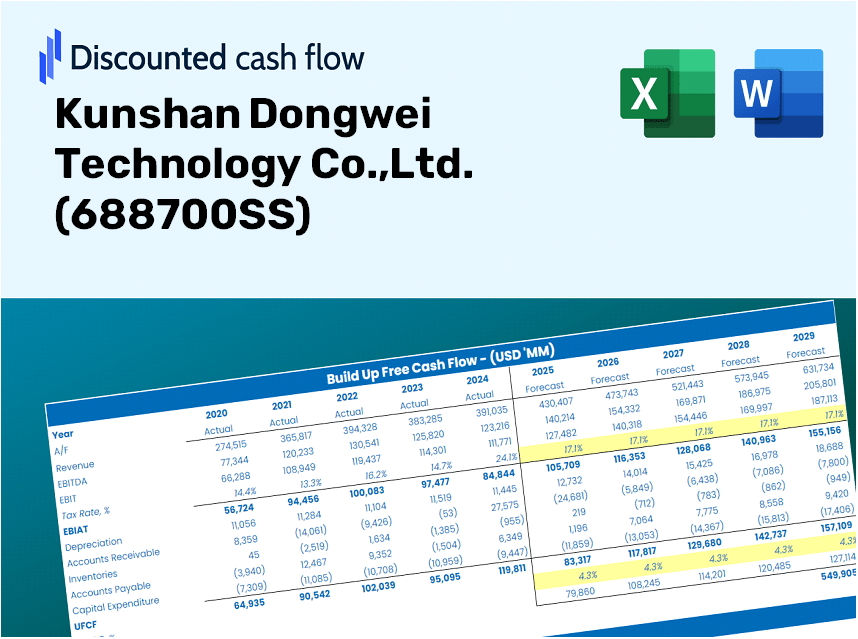
Obtenha informações sobre sua análise de avaliação Kunshan Dongwei Technology Co., Ltd. (688700SS) usando nossa sofisticada calculadora DCF! Este modelo do Excel é pré -carregado com dados reais (688700Ss), permitindo que você ajuste as previsões e suposições para determinar com precisão o valor intrínseco da Kunshan Dongwei Technology Co., Ltd.
Discounted Cash Flow (DCF) - (USD MM)
| Year | AY1 2020 |
AY2 2021 |
AY3 2022 |
AY4 2023 |
AY5 2024 |
FY1 2025 |
FY2 2026 |
FY3 2027 |
FY4 2028 |
FY5 2029 |
|---|---|---|---|---|---|---|---|---|---|---|
| Revenue | 554.5 | 804.6 | 1,011.7 | 909.2 | 750.0 | 831.0 | 920.8 | 1,020.2 | 1,130.4 | 1,252.5 |
| Revenue Growth, % | 0 | 45.11 | 25.74 | -10.13 | -17.51 | 10.8 | 10.8 | 10.8 | 10.8 | 10.8 |
| EBITDA | 94.1 | 170.3 | 230.6 | 153.9 | 72.7 | 145.5 | 161.2 | 178.6 | 197.9 | 219.3 |
| EBITDA, % | 16.97 | 21.16 | 22.79 | 16.93 | 9.69 | 17.51 | 17.51 | 17.51 | 17.51 | 17.51 |
| Depreciation | 5.2 | 6.2 | 11.4 | 19.9 | 24.0 | 13.6 | 15.1 | 16.8 | 18.6 | 20.6 |
| Depreciation, % | 0.92928 | 0.76776 | 1.12 | 2.19 | 3.2 | 1.64 | 1.64 | 1.64 | 1.64 | 1.64 |
| EBIT | 89.0 | 164.1 | 219.2 | 134.0 | 48.7 | 131.9 | 146.1 | 161.9 | 179.4 | 198.7 |
| EBIT, % | 16.04 | 20.4 | 21.67 | 14.74 | 6.49 | 15.87 | 15.87 | 15.87 | 15.87 | 15.87 |
| Total Cash | 145.9 | 444.2 | 381.8 | 406.5 | 320.7 | 343.6 | 380.7 | 421.8 | 467.4 | 517.9 |
| Total Cash, percent | .0 | .0 | .0 | .0 | .0 | .0 | .0 | .0 | .0 | .0 |
| Account Receivables | 357.9 | 536.1 | 669.2 | 742.7 | 735.4 | 626.7 | 694.4 | 769.4 | 852.5 | 944.6 |
| Account Receivables, % | 64.55 | 66.63 | 66.14 | 81.68 | 98.06 | 75.41 | 75.41 | 75.41 | 75.41 | 75.41 |
| Inventories | 223.9 | 341.4 | 374.1 | 411.6 | 634.1 | 414.9 | 459.7 | 509.3 | 564.4 | 625.3 |
| Inventories, % | 40.39 | 42.44 | 36.98 | 45.27 | 84.55 | 49.92 | 49.92 | 49.92 | 49.92 | 49.92 |
| Accounts Payable | 228.4 | 361.3 | 325.6 | 363.8 | 284.7 | 326.2 | 361.4 | 400.4 | 443.7 | 491.6 |
| Accounts Payable, % | 41.19 | 44.9 | 32.19 | 40.01 | 37.96 | 39.25 | 39.25 | 39.25 | 39.25 | 39.25 |
| Capital Expenditure | -54.7 | -59.2 | -157.6 | -100.0 | -78.2 | -90.1 | -99.9 | -110.6 | -122.6 | -135.8 |
| Capital Expenditure, % | -9.86 | -7.36 | -15.58 | -11 | -10.43 | -10.84 | -10.84 | -10.84 | -10.84 | -10.84 |
| Tax Rate, % | 5.87 | 5.87 | 5.87 | 5.87 | 5.87 | 5.87 | 5.87 | 5.87 | 5.87 | 5.87 |
| EBITAT | 79.1 | 146.6 | 199.0 | 120.0 | 45.8 | 119.4 | 132.3 | 146.6 | 162.4 | 179.9 |
| Depreciation | ||||||||||
| Changes in Account Receivables | ||||||||||
| Changes in Inventories | ||||||||||
| Changes in Accounts Payable | ||||||||||
| Capital Expenditure | ||||||||||
| UFCF | -323.9 | -69.2 | -148.7 | -32.9 | -302.7 | 412.4 | -29.7 | -32.9 | -36.5 | -40.5 |
| WACC, % | 4.69 | 4.69 | 4.69 | 4.69 | 4.69 | 4.69 | 4.69 | 4.69 | 4.69 | 4.69 |
| PV UFCF | ||||||||||
| SUM PV UFCF | 275.5 | |||||||||
| Long Term Growth Rate, % | 2.00 | |||||||||
| Free cash flow (T + 1) | -41 | |||||||||
| Terminal Value | -1,536 | |||||||||
| Present Terminal Value | -1,222 | |||||||||
| Enterprise Value | -946 | |||||||||
| Net Debt | -221 | |||||||||
| Equity Value | -725 | |||||||||
| Diluted Shares Outstanding, MM | 301 | |||||||||
| Equity Value Per Share | -2.41 |
What You'll Receive
- Customizable Excel Template: An adaptable Excel-based DCF Calculator featuring pre-loaded financials for Kunshan Dongwei Technology Co., Ltd. (688700SS).
- Accurate Data: Access to historical performance and future projections (highlighted in the yellow cells).
- Flexible Forecasting: Adjust key assumptions such as revenue growth, EBITDA percentage, and WACC.
- Instant Calculations: Quickly observe how your inputs affect the valuation of Kunshan Dongwei Technology Co., Ltd. (688700SS).
- Professional Resource: Designed for investors, CFOs, consultants, and financial analysts.
- User-Friendly Interface: Organized for simplicity and accessibility, complete with step-by-step guidance.
Key Features
- 🔍 Real-Life Kunshan Dongwei Financials: Pre-filled historical and projected data for Kunshan Dongwei Technology Co., Ltd. (688700SS).
- ✏️ Fully Customizable Inputs: Modify all essential parameters (yellow cells) such as WACC, growth %, and tax rates.
- 📊 Professional DCF Valuation: Integrated formulas determine Kunshan Dongwei’s intrinsic value utilizing the Discounted Cash Flow method.
- ⚡ Instant Results: Quickly visualize Kunshan Dongwei’s valuation following any adjustments.
- Scenario Analysis: Analyze and compare different financial assumptions side-by-side.
How It Operates
- Step 1: Download the Excel spreadsheet.
- Step 2: Examine Kunshan Dongwei Technology Co., Ltd.'s pre-filled financial figures and projections.
- Step 3: Adjust key inputs such as revenue growth, WACC, and tax rates (highlighted cells).
- Step 4: Observe the DCF model refresh in real-time as you modify the assumptions.
- Step 5: Review the outputs and utilize the findings for investment evaluations.
Why Choose the Kunshan Dongwei Technology Co., Ltd. Calculator?
- All-in-One Solution: Combines DCF, WACC, and financial ratio analyses into a single, user-friendly tool.
- Flexible Customization: Modify the yellow-highlighted cells to explore different financial scenarios.
- In-Depth Analysis: Automatically computes the intrinsic value and Net Present Value for Kunshan Dongwei Technology Co., Ltd. (688700SS).
- Preloaded Information: Access both historical and projected data for reliable analysis.
- High-Quality Standards: Perfect for financial analysts, investors, and business consultants looking for accurate assessments.
Who Can Benefit from This Product?
- Institutional Investors: Develop comprehensive and accurate valuation models for effective portfolio management.
- Corporate Finance Professionals: Evaluate valuation scenarios to inform strategic decision-making.
- Financial Consultants and Advisors: Deliver precise valuation insights for Kunshan Dongwei Technology Co.,Ltd. (688700SS) to clients.
- Academics and Students: Utilize real-world data for practicing and teaching financial modeling techniques.
- Technology Sector Enthusiasts: Gain insights into how tech firms like Kunshan Dongwei Technology Co.,Ltd. (688700SS) are assessed in the market.
Contents of the Template
- Pre-Populated Data: Features Kunshan Dongwei Technology Co., Ltd.'s historical financial metrics and projections.
- Discounted Cash Flow (DCF) Model: An editable DCF valuation model with automatic computation capabilities.
- Weighted Average Cost of Capital (WACC): A specific worksheet designed for WACC calculations based on user-defined inputs.
- Essential Financial Ratios: Assess Kunshan Dongwei Technology's profitability, operational efficiency, and capital structure.
- Flexible Inputs: Easily modify revenue growth, profit margins, and tax rates.
- User-Friendly Dashboard: Visual charts and tables that encapsulate key valuation outcomes.
Disclaimer
All information, articles, and product details provided on this website are for general informational and educational purposes only. We do not claim any ownership over, nor do we intend to infringe upon, any trademarks, copyrights, logos, brand names, or other intellectual property mentioned or depicted on this site. Such intellectual property remains the property of its respective owners, and any references here are made solely for identification or informational purposes, without implying any affiliation, endorsement, or partnership.
We make no representations or warranties, express or implied, regarding the accuracy, completeness, or suitability of any content or products presented. Nothing on this website should be construed as legal, tax, investment, financial, medical, or other professional advice. In addition, no part of this site—including articles or product references—constitutes a solicitation, recommendation, endorsement, advertisement, or offer to buy or sell any securities, franchises, or other financial instruments, particularly in jurisdictions where such activity would be unlawful.
All content is of a general nature and may not address the specific circumstances of any individual or entity. It is not a substitute for professional advice or services. Any actions you take based on the information provided here are strictly at your own risk. You accept full responsibility for any decisions or outcomes arising from your use of this website and agree to release us from any liability in connection with your use of, or reliance upon, the content or products found herein.