
|
Casio Computer Co., Ltd. (6952.T) Avaliação DCF |
Totalmente Editável: Adapte-Se Às Suas Necessidades No Excel Ou Planilhas
Design Profissional: Modelos Confiáveis E Padrão Da Indústria
Pré-Construídos Para Uso Rápido E Eficiente
Compatível com MAC/PC, totalmente desbloqueado
Não É Necessária Experiência; Fácil De Seguir
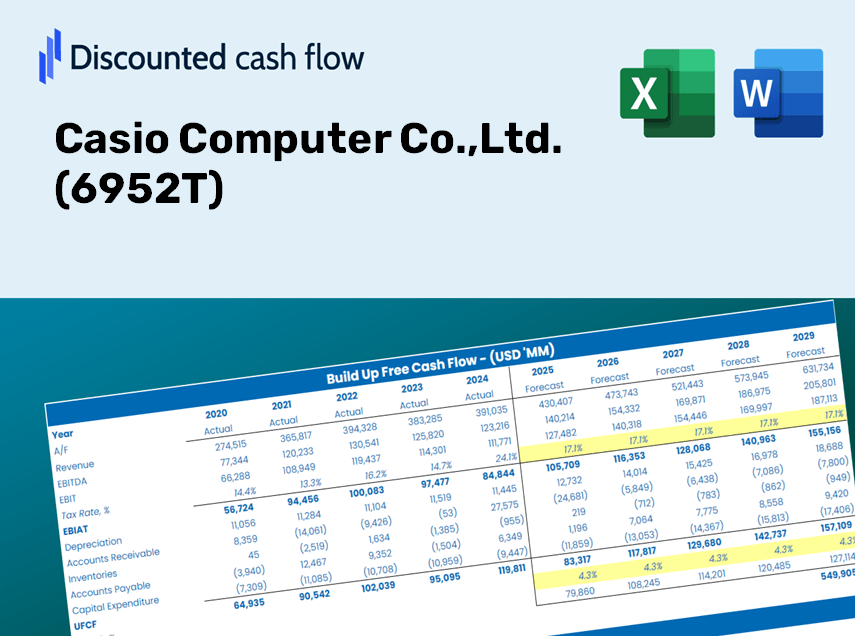
Casio Computer Co.,Ltd. (6952.T) Bundle
Aprimore suas estratégias de investimento com a calculadora DCF (6952T)! Analisar dados financeiros genuínos da Casio, ajustar as projeções e despesas de crescimento e observar instantaneamente como essas modificações afetam o valor intrínseco de Casio.
Discounted Cash Flow (DCF) - (USD MM)
| Year | AY1 2021 |
AY2 2022 |
AY3 2023 |
AY4 2024 |
AY5 2025 |
FY1 2026 |
FY2 2027 |
FY3 2028 |
FY4 2029 |
FY5 2030 |
|---|---|---|---|---|---|---|---|---|---|---|
| Revenue | 227,440.0 | 252,322.0 | 263,831.0 | 268,828.0 | 261,757.0 | 271,419.1 | 281,437.8 | 291,826.4 | 302,598.4 | 313,768.0 |
| Revenue Growth, % | 0 | 10.94 | 4.56 | 1.89 | -2.63 | 3.69 | 3.69 | 3.69 | 3.69 | 3.69 |
| EBITDA | 29,278.0 | 34,557.0 | 28,046.0 | 29,776.0 | 22,872.0 | 30,948.7 | 32,091.1 | 33,275.7 | 34,504.0 | 35,777.6 |
| EBITDA, % | 12.87 | 13.7 | 10.63 | 11.08 | 8.74 | 11.4 | 11.4 | 11.4 | 11.4 | 11.4 |
| Depreciation | 11,137.0 | 11,426.0 | 10,962.0 | 11,855.0 | 10,710.0 | 11,986.6 | 12,429.1 | 12,887.9 | 13,363.6 | 13,856.9 |
| Depreciation, % | 4.9 | 4.53 | 4.15 | 4.41 | 4.09 | 4.42 | 4.42 | 4.42 | 4.42 | 4.42 |
| EBIT | 18,141.0 | 23,131.0 | 17,084.0 | 17,921.0 | 12,162.0 | 18,962.1 | 19,662.0 | 20,387.8 | 21,140.4 | 21,920.7 |
| EBIT, % | 7.98 | 9.17 | 6.48 | 6.67 | 4.65 | 6.99 | 6.99 | 6.99 | 6.99 | 6.99 |
| Total Cash | 140,475.0 | 135,093.0 | 130,674.0 | 144,660.0 | 141,127.0 | 147,955.7 | 153,417.1 | 159,080.1 | 164,952.2 | 171,040.9 |
| Total Cash, percent | .0 | .0 | .0 | .0 | .0 | .0 | .0 | .0 | .0 | .0 |
| Account Receivables | 29,275.0 | 28,396.0 | 29,748.0 | 31,959.0 | 27,761.0 | 31,427.5 | 32,587.5 | 33,790.4 | 35,037.7 | 36,331.0 |
| Account Receivables, % | 12.87 | 11.25 | 11.28 | 11.89 | 10.61 | 11.58 | 11.58 | 11.58 | 11.58 | 11.58 |
| Inventories | 49,401.0 | 60,817.0 | 65,116.0 | 61,574.0 | 59,035.0 | 62,948.8 | 65,272.4 | 67,681.7 | 70,180.0 | 72,770.5 |
| Inventories, % | 21.72 | 24.1 | 24.68 | 22.9 | 22.55 | 23.19 | 23.19 | 23.19 | 23.19 | 23.19 |
| Accounts Payable | 20,920.0 | 19,235.0 | 16,650.0 | 16,235.0 | 16,711.0 | 19,300.8 | 20,013.3 | 20,752.0 | 21,518.0 | 22,312.3 |
| Accounts Payable, % | 9.2 | 7.62 | 6.31 | 6.04 | 6.38 | 7.11 | 7.11 | 7.11 | 7.11 | 7.11 |
| Capital Expenditure | -8,326.0 | -10,974.0 | -11,046.0 | -9,916.0 | -3,510.0 | -9,351.1 | -9,696.2 | -10,054.2 | -10,425.3 | -10,810.1 |
| Capital Expenditure, % | -3.66 | -4.35 | -4.19 | -3.69 | -1.34 | -3.45 | -3.45 | -3.45 | -3.45 | -3.45 |
| Tax Rate, % | 31.05 | 31.05 | 31.05 | 31.05 | 31.05 | 31.05 | 31.05 | 31.05 | 31.05 | 31.05 |
| EBITAT | 12,170.3 | 16,042.3 | 13,274.8 | 12,140.7 | 8,386.0 | 13,305.4 | 13,796.6 | 14,305.8 | 14,833.9 | 15,381.5 |
| Depreciation | ||||||||||
| Changes in Account Receivables | ||||||||||
| Changes in Inventories | ||||||||||
| Changes in Accounts Payable | ||||||||||
| Capital Expenditure | ||||||||||
| UFCF | -42,774.7 | 4,272.3 | 4,954.8 | 14,995.7 | 22,799.0 | 10,950.6 | 13,758.2 | 14,266.0 | 14,792.6 | 15,338.7 |
| WACC, % | 4.37 | 4.39 | 4.43 | 4.38 | 4.38 | 4.39 | 4.39 | 4.39 | 4.39 | 4.39 |
| PV UFCF | ||||||||||
| SUM PV UFCF | 60,484.4 | |||||||||
| Long Term Growth Rate, % | 3.00 | |||||||||
| Free cash flow (T + 1) | 15,799 | |||||||||
| Terminal Value | 1,135,514 | |||||||||
| Present Terminal Value | 915,947 | |||||||||
| Enterprise Value | 976,431 | |||||||||
| Net Debt | -25,413 | |||||||||
| Equity Value | 1,001,844 | |||||||||
| Diluted Shares Outstanding, MM | 229 | |||||||||
| Equity Value Per Share | 4,375.23 |
What You Will Receive
- Comprehensive Financial Model: Leveraging Casio’s real data for an accurate DCF valuation.
- Full Forecast Customization: Modify revenue growth, profit margins, WACC, and essential metrics.
- Real-Time Calculations: Automatic updates allow you to instantly see the impact of your adjustments.
- Professional-Grade Template: A polished Excel file crafted for high-quality valuation presentations.
- Flexible and Reusable: Designed for adaptability, making it easy to reuse for in-depth forecasts.
Key Features
- Comprehensive Data: Casio's historical financial statements and pre-populated forecasts.
- Customizable Inputs: Adjust WACC, tax rates, revenue growth, and EBITDA margins as needed.
- Real-Time Insights: View the intrinsic value of Casio recalculated instantly.
- Intuitive Visual Outputs: Dashboard charts showcase valuation results and essential metrics.
- Designed for Precision: A professional-grade tool for analysts, investors, and finance professionals.
How It Functions
- Download the Template: Obtain immediate access to the Excel-based Casio DCF Calculator.
- Input Your Assumptions: Modify the yellow-highlighted fields for growth rates, WACC, margins, and other key metrics.
- Instant Calculations: The model automatically recalculates Casio's intrinsic value.
- Test Scenarios: Explore various assumptions to assess potential changes in valuation.
- Analyze and Decide: Utilize the findings to inform your investment or financial strategy.
Why Opt for This Calculator?
- All-in-One Solution: Features DCF, WACC, and financial ratio analyses seamlessly integrated.
- Customizable Options: Easily modify highlighted cells to explore different scenarios.
- In-Depth Analysis: Automatically computes Casio's intrinsic value and Net Present Value.
- Data Ready: Comes with historical and projected data for precise calculations.
- Expert Level: Perfect for financial analysts, investors, and business consultants.
Who Can Benefit from Casio Computer Co., Ltd. (6952T)?
- Investors: Gain insights and make informed investment decisions with advanced analytical tools.
- Financial Analysts: Streamline your analysis process with customizable financial models.
- Consultants: Effortlessly modify reports and presentations to suit client needs.
- Tech Enthusiasts: Enhance your knowledge of market trends and innovations in the tech industry.
- Educators and Students: Utilize real-world case studies to enrich finance and technology education.
Contents of the Template
- Operating and Balance Sheet Data: Pre-filled historical data and forecasts for Casio Computer Co., Ltd. (6952T), including revenue, EBITDA, EBIT, and capital expenditures.
- WACC Calculation: A dedicated sheet for the Weighted Average Cost of Capital (WACC), featuring key parameters such as Beta, risk-free rate, and share price.
- DCF Valuation (Unlevered and Levered): Customizable Discounted Cash Flow models illustrating intrinsic value with comprehensive calculations.
- Financial Statements: Pre-loaded annual and quarterly financial statements to facilitate thorough analysis.
- Key Ratios: A collection of profitability, leverage, and efficiency ratios specific to Casio Computer Co., Ltd. (6952T).
- Dashboard and Charts: A visual overview of valuation results and assumptions for straightforward analysis.
Disclaimer
All information, articles, and product details provided on this website are for general informational and educational purposes only. We do not claim any ownership over, nor do we intend to infringe upon, any trademarks, copyrights, logos, brand names, or other intellectual property mentioned or depicted on this site. Such intellectual property remains the property of its respective owners, and any references here are made solely for identification or informational purposes, without implying any affiliation, endorsement, or partnership.
We make no representations or warranties, express or implied, regarding the accuracy, completeness, or suitability of any content or products presented. Nothing on this website should be construed as legal, tax, investment, financial, medical, or other professional advice. In addition, no part of this site—including articles or product references—constitutes a solicitation, recommendation, endorsement, advertisement, or offer to buy or sell any securities, franchises, or other financial instruments, particularly in jurisdictions where such activity would be unlawful.
All content is of a general nature and may not address the specific circumstances of any individual or entity. It is not a substitute for professional advice or services. Any actions you take based on the information provided here are strictly at your own risk. You accept full responsibility for any decisions or outcomes arising from your use of this website and agree to release us from any liability in connection with your use of, or reliance upon, the content or products found herein.