
|
Rohm Co., Ltd. (6963.T) Avaliação DCF |
Totalmente Editável: Adapte-Se Às Suas Necessidades No Excel Ou Planilhas
Design Profissional: Modelos Confiáveis E Padrão Da Indústria
Pré-Construídos Para Uso Rápido E Eficiente
Compatível com MAC/PC, totalmente desbloqueado
Não É Necessária Experiência; Fácil De Seguir
ROHM Co., Ltd. (6963.T) Bundle
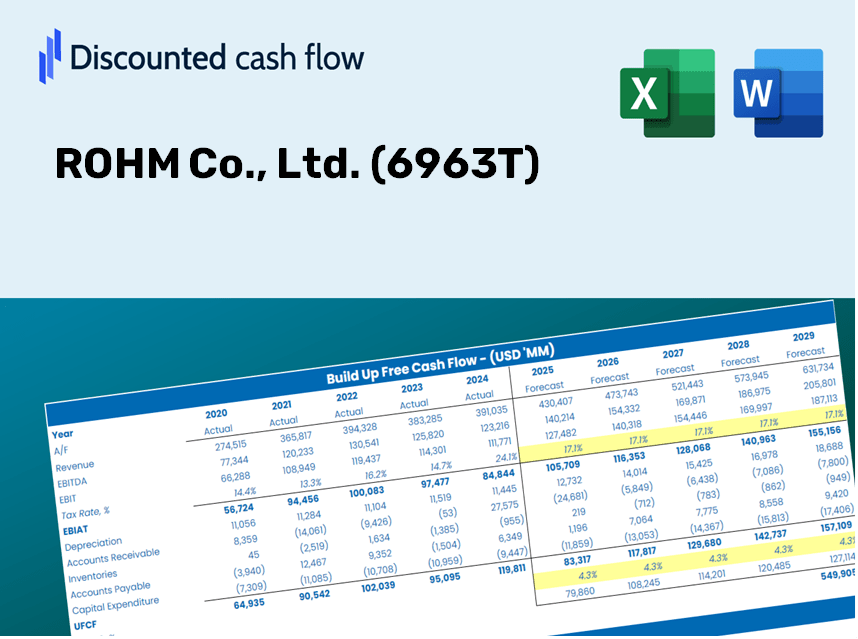
Obtenha informações sobre a análise de avaliação da Rohm Co., Ltd. (6963T) usando nossa calculadora DCF de última geração! Equipado com dados reais (6963T), este modelo do Excel permite ajustar as previsões e suposições para determinar com precisão o valor intrínseco da Rohm Co., Ltd.
Benefits You Will Receive
- Adjustable Forecast Inputs: Easily modify assumptions (growth %, margins, WACC) to create various scenarios.
- Comprehensive Data: ROHM Co., Ltd.’s financial information pre-loaded to kickstart your analysis.
- Automatic DCF Calculations: The template computes Net Present Value (NPV) and intrinsic value automatically for you.
- Customizable and Professional Design: A sleek Excel model tailored to meet your valuation requirements.
- Designed for Analysts and Investors: Perfect for evaluating projections, validating strategies, and saving valuable time.
Key Features
- Pre-Loaded Data: ROHM Co., Ltd.’s historical financial statements and pre-filled forecasts.
- Fully Adjustable Inputs: Customize WACC, tax rates, revenue growth, and EBITDA margins.
- Instant Results: Watch ROHM Co., Ltd.’s intrinsic value recalibrate in real time.
- Clear Visual Outputs: Dashboard charts showcase valuation results and key metrics.
- Built for Accuracy: A professional tool designed for analysts, investors, and finance professionals.
How It Functions
- Download the Template: Gain immediate access to the Excel-based ROHM Co., Ltd. (6963T) DCF Calculator.
- Input Your Assumptions: Modify the yellow-highlighted cells for growth rates, WACC, profit margins, and more.
- Instant Calculations: The model automatically recalculates the intrinsic value of ROHM Co., Ltd. (6963T).
- Test Scenarios: Experiment with various assumptions to assess potential changes in valuation.
- Analyze and Decide: Utilize the results to inform your investment strategy or financial assessments.
Why Opt for ROHM’s Calculator?
- Precision: Utilizes accurate financial data from ROHM Co., Ltd. for reliable results.
- Adaptability: Allows users to easily test and modify inputs to suit their needs.
- Efficiency: Eliminate the need to create a DCF model from the ground up.
- High-Quality: Crafted with the level of detail and usability expected by CFOs.
- Intuitive: Simple to navigate, ideal for users without extensive financial modeling skills.
Who Can Benefit from This Product?
- Investors: Evaluate ROHM Co., Ltd.'s ([6963T]) valuation prior to making investment decisions.
- CFOs and Financial Analysts: Optimize valuation methodologies and assess financial forecasts.
- Startup Founders: Gain insights into how established firms like ROHM Co., Ltd. are valued.
- Consultants: Provide clients with comprehensive valuation reports.
- Students and Educators: Utilize actual market data to learn and instruct on valuation practices.
Contents of the Template
- Pre-Filled Data: Features ROHM Co., Ltd.’s historical financials and forecasts.
- Discounted Cash Flow Model: Editable DCF valuation model with automatic computations.
- Weighted Average Cost of Capital (WACC): A dedicated sheet for WACC calculation based on user-defined inputs.
- Key Financial Ratios: Examine ROHM Co., Ltd.'s profitability, efficiency, and leverage.
- Customizable Inputs: Easily modify revenue growth, margins, and tax rates.
- Clear Dashboard: Visuals and tables summarizing essential valuation results.
Disclaimer
All information, articles, and product details provided on this website are for general informational and educational purposes only. We do not claim any ownership over, nor do we intend to infringe upon, any trademarks, copyrights, logos, brand names, or other intellectual property mentioned or depicted on this site. Such intellectual property remains the property of its respective owners, and any references here are made solely for identification or informational purposes, without implying any affiliation, endorsement, or partnership.
We make no representations or warranties, express or implied, regarding the accuracy, completeness, or suitability of any content or products presented. Nothing on this website should be construed as legal, tax, investment, financial, medical, or other professional advice. In addition, no part of this site—including articles or product references—constitutes a solicitation, recommendation, endorsement, advertisement, or offer to buy or sell any securities, franchises, or other financial instruments, particularly in jurisdictions where such activity would be unlawful.
All content is of a general nature and may not address the specific circumstances of any individual or entity. It is not a substitute for professional advice or services. Any actions you take based on the information provided here are strictly at your own risk. You accept full responsibility for any decisions or outcomes arising from your use of this website and agree to release us from any liability in connection with your use of, or reliance upon, the content or products found herein.