
|
Avaliação do ZJLD Group Inc (6979.HK) DCF |
Totalmente Editável: Adapte-Se Às Suas Necessidades No Excel Ou Planilhas
Design Profissional: Modelos Confiáveis E Padrão Da Indústria
Pré-Construídos Para Uso Rápido E Eficiente
Compatível com MAC/PC, totalmente desbloqueado
Não É Necessária Experiência; Fácil De Seguir
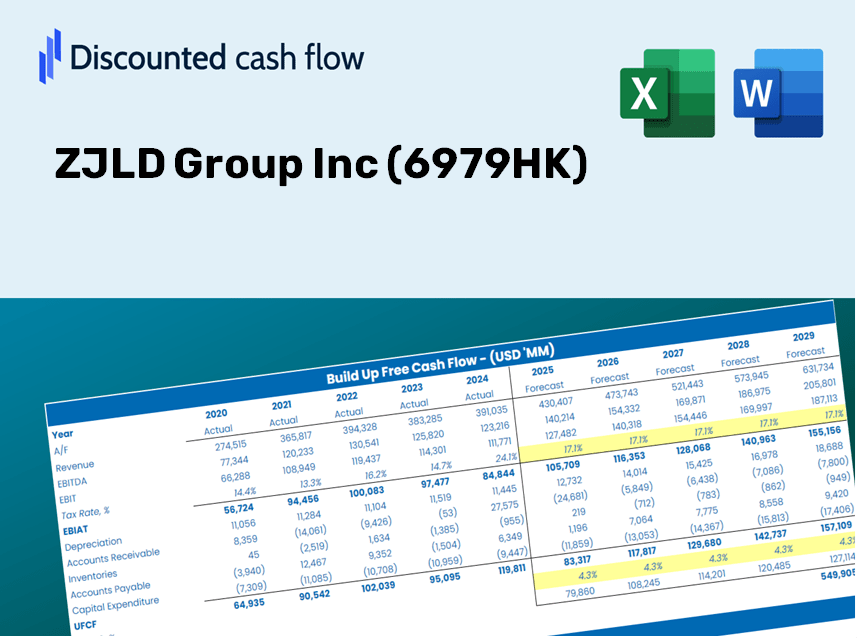
ZJLD Group Inc (6979.HK) Bundle
Projetado para precisão, a nossa calculadora DCF (6979HK) permite avaliar a avaliação do ZJLD Group Inc usando dados financeiros do mundo real, oferecendo flexibilidade completa para modificar todos os parâmetros essenciais para melhorar projeções.
Discounted Cash Flow (DCF) - (USD MM)
| Year | AY1 2020 |
AY2 2021 |
AY3 2022 |
AY4 2023 |
AY5 2024 |
FY1 2025 |
FY2 2026 |
FY3 2027 |
FY4 2028 |
FY5 2029 |
|---|---|---|---|---|---|---|---|---|---|---|
| Revenue | 2,621.0 | 5,573.9 | 6,398.1 | 7,681.4 | 7,721.1 | 10,333.9 | 13,830.9 | 18,511.2 | 24,775.4 | 33,159.5 |
| Revenue Growth, % | 0 | 112.66 | 14.79 | 20.06 | 0.51657 | 33.84 | 33.84 | 33.84 | 33.84 | 33.84 |
| EBITDA | 854.6 | 1,659.9 | 1,872.1 | 2,372.5 | 2,083.3 | 3,090.2 | 4,135.9 | 5,535.4 | 7,408.6 | 9,915.7 |
| EBITDA, % | 32.61 | 29.78 | 29.26 | 30.89 | 26.98 | 29.9 | 29.9 | 29.9 | 29.9 | 29.9 |
| Depreciation | 46.3 | 68.3 | 129.9 | 229.7 | 229.7 | 227.1 | 303.9 | 406.7 | 544.4 | 728.6 |
| Depreciation, % | 1.77 | 1.23 | 2.03 | 2.99 | 2.97 | 2.2 | 2.2 | 2.2 | 2.2 | 2.2 |
| EBIT | 808.4 | 1,591.6 | 1,742.2 | 2,142.9 | 1,853.6 | 2,863.1 | 3,832.0 | 5,128.7 | 6,864.3 | 9,187.1 |
| EBIT, % | 30.84 | 28.55 | 27.23 | 27.9 | 24.01 | 27.71 | 27.71 | 27.71 | 27.71 | 27.71 |
| Total Cash | 343.7 | 1,688.3 | 1,840.0 | 6,614.0 | 6,173.3 | 4,923.4 | 6,589.5 | 8,819.4 | 11,803.9 | 15,798.3 |
| Total Cash, percent | .0 | .0 | .0 | .0 | .0 | .0 | .0 | .0 | .0 | .0 |
| Account Receivables | 81.0 | 70.7 | 196.4 | 265.6 | 591.9 | 383.5 | 513.3 | 686.9 | 919.4 | 1,230.5 |
| Account Receivables, % | 3.09 | 1.27 | 3.07 | 3.46 | 7.67 | 3.71 | 3.71 | 3.71 | 3.71 | 3.71 |
| Inventories | 1,900.7 | 3,993.8 | 5,631.1 | 6,974.5 | 8,198.1 | 8,742.0 | 11,700.3 | 15,659.7 | 20,958.9 | 28,051.4 |
| Inventories, % | 72.52 | 71.65 | 88.01 | 90.8 | 106.18 | 84.6 | 84.6 | 84.6 | 84.6 | 84.6 |
| Accounts Payable | 158.1 | 601.6 | 1,142.3 | 1,169.1 | 1,556.7 | 1,448.0 | 1,938.0 | 2,593.8 | 3,471.5 | 4,646.3 |
| Accounts Payable, % | 6.03 | 10.79 | 17.85 | 15.22 | 20.16 | 14.01 | 14.01 | 14.01 | 14.01 | 14.01 |
| Capital Expenditure | -220.6 | -694.7 | -1,165.7 | -937.7 | -1,175.9 | -1,375.1 | -1,840.5 | -2,463.3 | -3,296.9 | -4,412.6 |
| Capital Expenditure, % | -8.41 | -12.46 | -18.22 | -12.21 | -15.23 | -13.31 | -13.31 | -13.31 | -13.31 | -13.31 |
| Tax Rate, % | 30.13 | 30.13 | 30.13 | 30.13 | 30.13 | 30.13 | 30.13 | 30.13 | 30.13 | 30.13 |
| EBITAT | 599.3 | 1,166.3 | 1,250.3 | 1,728.1 | 1,295.2 | 2,116.9 | 2,833.3 | 3,792.1 | 5,075.3 | 6,792.8 |
| Depreciation | ||||||||||
| Changes in Account Receivables | ||||||||||
| Changes in Inventories | ||||||||||
| Changes in Accounts Payable | ||||||||||
| Capital Expenditure | ||||||||||
| UFCF | -1,398.6 | -1,099.4 | -1,007.8 | -365.9 | -813.4 | 524.7 | -1,301.4 | -1,741.7 | -2,331.1 | -3,120.0 |
| WACC, % | 8.8 | 8.8 | 8.8 | 8.81 | 8.8 | 8.8 | 8.8 | 8.8 | 8.8 | 8.8 |
| PV UFCF | ||||||||||
| SUM PV UFCF | -5,679.2 | |||||||||
| Long Term Growth Rate, % | 2.00 | |||||||||
| Free cash flow (T + 1) | -3,182 | |||||||||
| Terminal Value | -46,789 | |||||||||
| Present Terminal Value | -30,688 | |||||||||
| Enterprise Value | -36,367 | |||||||||
| Net Debt | -5,584 | |||||||||
| Equity Value | -30,784 | |||||||||
| Diluted Shares Outstanding, MM | 3,310 | |||||||||
| Equity Value Per Share | -9.30 |
What You Will Receive
- Authentic ZJLD Data: Preloaded financial metrics – encompassing revenue to EBIT – derived from actual and anticipated figures.
- Comprehensive Customization: Modify all essential parameters (yellow cells) such as WACC, growth %, and tax rates to fit your analysis.
- Immediate Valuation Adjustments: Automatic recalculations to assess how changes affect the fair value of ZJLD Group Inc (6979HK).
- Flexible Excel Template: Designed for effortless edits, scenario analysis, and in-depth projections.
- Efficient and Precise: Eliminate the need to construct models from the ground up while ensuring accuracy and adaptability.
Key Features
- 🔍 Real-Life ZJLD Financials: Pre-filled historical and projected data for ZJLD Group Inc (6979HK).
- ✏️ Fully Customizable Inputs: Modify all essential parameters (yellow cells) such as WACC, growth %, and tax rates.
- 📊 Professional DCF Valuation: Integrated formulas calculate ZJLD's intrinsic value using the Discounted Cash Flow method.
- ⚡ Instant Results: Visualize ZJLD's valuation immediately after adjustments.
- Scenario Analysis: Experiment with and compare outcomes based on varying financial assumptions side-by-side.
How It Works
- Step 1: Download the Excel file.
- Step 2: Examine ZJLD Group Inc’s (6979HK) pre-filled financial data and projections.
- Step 3: Adjust key parameters such as revenue growth, WACC, and tax rates (highlighted cells).
- Step 4: Observe the DCF model update in real-time as you modify your assumptions.
- Step 5: Evaluate the outputs and apply the findings to your investment strategies.
Reasons to Use the ZJLD Group Inc (6979HK) Calculator
- Precise Information: Current ZJLD Group financial data provides trustworthy valuation outcomes.
- Tailorable: Modify essential variables such as growth rates, WACC, and tax rates to align with your forecasts.
- Efficiency: Pre-configured calculations save you from having to build from the ground up.
- Expert-Level Tool: Ideal for investors, analysts, and consultants alike.
- Easy to Use: Intuitive design and guided steps make it accessible for users of all experience levels.
Who Can Benefit from This Product?
- Investors: Evaluate the valuation of ZJLD Group Inc (6979HK) prior to making stock transactions.
- CFOs and Financial Analysts: Enhance valuation methodologies and validate financial forecasts.
- Startup Founders: Gain insights into the valuation processes used by established public companies like ZJLD Group Inc (6979HK).
- Consultants: Create detailed valuation reports for your clients based on ZJLD Group Inc (6979HK).
- Students and Educators: Utilize real-time data to learn and instruct valuation practices.
Contents of the Template
- Comprehensive DCF Model: Editable template featuring detailed valuation calculations.
- Real-World Data: ZJLD Group Inc’s (6979HK) historical and projected financials preloaded for analysis.
- Customizable Parameters: Modify WACC, growth rates, and tax assumptions to explore various scenarios.
- Financial Statements: Complete annual and quarterly breakdowns for in-depth insights.
- Key Ratios: Integrated analysis for profitability, efficiency, and leverage metrics.
- Dashboard with Visual Outputs: Charts and tables providing clear, actionable results.
Disclaimer
All information, articles, and product details provided on this website are for general informational and educational purposes only. We do not claim any ownership over, nor do we intend to infringe upon, any trademarks, copyrights, logos, brand names, or other intellectual property mentioned or depicted on this site. Such intellectual property remains the property of its respective owners, and any references here are made solely for identification or informational purposes, without implying any affiliation, endorsement, or partnership.
We make no representations or warranties, express or implied, regarding the accuracy, completeness, or suitability of any content or products presented. Nothing on this website should be construed as legal, tax, investment, financial, medical, or other professional advice. In addition, no part of this site—including articles or product references—constitutes a solicitation, recommendation, endorsement, advertisement, or offer to buy or sell any securities, franchises, or other financial instruments, particularly in jurisdictions where such activity would be unlawful.
All content is of a general nature and may not address the specific circumstances of any individual or entity. It is not a substitute for professional advice or services. Any actions you take based on the information provided here are strictly at your own risk. You accept full responsibility for any decisions or outcomes arising from your use of this website and agree to release us from any liability in connection with your use of, or reliance upon, the content or products found herein.