
|
Kawasaki Heavy Industries, Ltd. (7012.T) Avaliação DCF |
Totalmente Editável: Adapte-Se Às Suas Necessidades No Excel Ou Planilhas
Design Profissional: Modelos Confiáveis E Padrão Da Indústria
Pré-Construídos Para Uso Rápido E Eficiente
Compatível com MAC/PC, totalmente desbloqueado
Não É Necessária Experiência; Fácil De Seguir
Kawasaki Heavy Industries, Ltd. (7012.T) Bundle
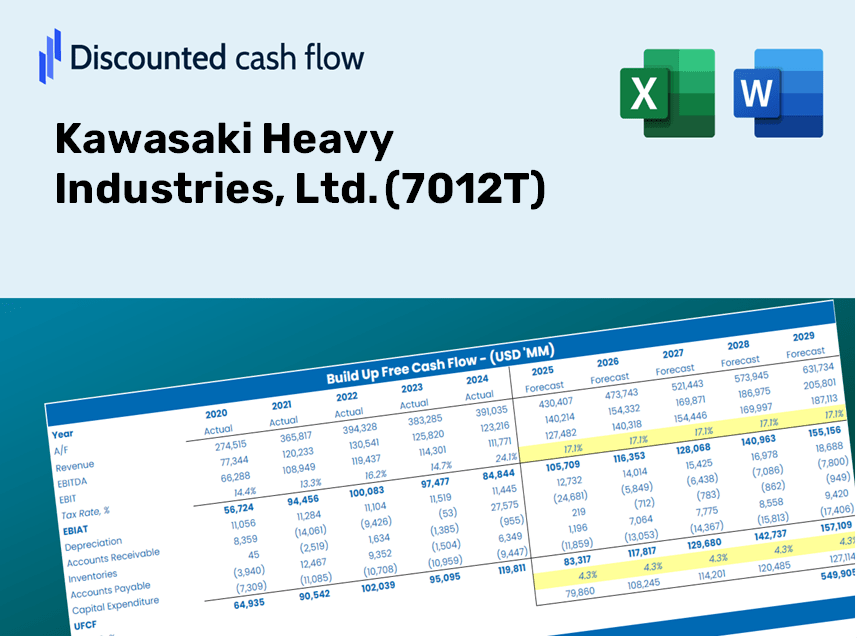
Projetado para precisão, nossa calculadora DCF (7012T) permite avaliar a avaliação da Kawasaki Heavy Industries, Ltd. usando dados financeiros do mundo real, oferecendo flexibilidade completa para modificar todos os parâmetros-chave para projeções aprimoradas.
Discounted Cash Flow (DCF) - (USD MM)
| Year | AY1 2021 |
AY2 2022 |
AY3 2023 |
AY4 2024 |
AY5 2025 |
FY1 2026 |
FY2 2027 |
FY3 2028 |
FY4 2029 |
FY5 2030 |
|---|---|---|---|---|---|---|---|---|---|---|
| Revenue | 1,488,486.0 | 1,500,879.0 | 1,725,609.0 | 1,849,287.0 | 2,129,321.0 | 2,332,223.1 | 2,554,459.7 | 2,797,873.1 | 3,064,481.3 | 3,356,494.4 |
| Revenue Growth, % | 0 | 0.83259 | 14.97 | 7.17 | 15.14 | 9.53 | 9.53 | 9.53 | 9.53 | 9.53 |
| EBITDA | 50,360.0 | 109,919.0 | 154,012.0 | 130,223.0 | 239,977.0 | 176,987.5 | 193,852.5 | 212,324.7 | 232,557.0 | 254,717.2 |
| EBITDA, % | 3.38 | 7.32 | 8.93 | 7.04 | 11.27 | 7.59 | 7.59 | 7.59 | 7.59 | 7.59 |
| Depreciation | 61,258.0 | 76,998.0 | 77,374.0 | 80,982.0 | 93,431.0 | 104,933.4 | 114,932.5 | 125,884.4 | 137,879.8 | 151,018.4 |
| Depreciation, % | 4.12 | 5.13 | 4.48 | 4.38 | 4.39 | 4.5 | 4.5 | 4.5 | 4.5 | 4.5 |
| EBIT | -10,898.0 | 32,921.0 | 76,638.0 | 49,241.0 | 146,546.0 | 72,054.0 | 78,920.0 | 86,440.3 | 94,677.1 | 103,698.9 |
| EBIT, % | -0.73215 | 2.19 | 4.44 | 2.66 | 6.88 | 3.09 | 3.09 | 3.09 | 3.09 | 3.09 |
| Total Cash | 126,702.0 | 119,117.0 | 138,420.0 | 95,177.0 | 144,546.0 | 169,810.0 | 185,991.2 | 203,714.2 | 223,126.0 | 244,387.6 |
| Total Cash, percent | .0 | .0 | .0 | .0 | .0 | .0 | .0 | .0 | .0 | .0 |
| Account Receivables | 456,847.0 | 414,717.0 | 629,820.0 | 817,736.0 | 934,939.0 | 853,355.4 | 934,671.3 | 1,023,735.7 | 1,121,287.1 | 1,228,134.1 |
| Account Receivables, % | 30.69 | 27.63 | 36.5 | 44.22 | 43.91 | 36.59 | 36.59 | 36.59 | 36.59 | 36.59 |
| Inventories | 658,542.0 | 615,476.0 | 690,431.0 | 710,207.0 | 775,434.0 | 933,273.1 | 1,022,204.3 | 1,119,609.8 | 1,226,296.9 | 1,343,150.2 |
| Inventories, % | 44.24 | 41.01 | 40.01 | 38.4 | 36.42 | 40.02 | 40.02 | 40.02 | 40.02 | 40.02 |
| Accounts Payable | 247,294.0 | 399,892.0 | 452,250.0 | 521,734.0 | 593,878.0 | 585,709.8 | 641,521.8 | 702,652.2 | 769,607.6 | 842,943.2 |
| Accounts Payable, % | 16.61 | 26.64 | 26.21 | 28.21 | 27.89 | 25.11 | 25.11 | 25.11 | 25.11 | 25.11 |
| Capital Expenditure | -51,692.0 | -58,943.0 | -58,943.0 | -80,063.0 | -98,682.0 | -92,261.0 | -101,052.6 | -110,681.8 | -121,228.6 | -132,780.5 |
| Capital Expenditure, % | -3.47 | -3.93 | -3.42 | -4.33 | -4.63 | -3.96 | -3.96 | -3.96 | -3.96 | -3.96 |
| Tax Rate, % | 18.15 | 18.15 | 18.15 | 18.15 | 18.15 | 18.15 | 18.15 | 18.15 | 18.15 | 18.15 |
| EBITAT | -14,343.7 | 15,036.3 | 57,769.6 | 39,074.1 | 119,944.5 | 55,085.9 | 60,335.0 | 66,084.3 | 72,381.5 | 79,278.7 |
| Depreciation | ||||||||||
| Changes in Account Receivables | ||||||||||
| Changes in Inventories | ||||||||||
| Changes in Accounts Payable | ||||||||||
| Capital Expenditure | ||||||||||
| UFCF | -872,872.7 | 270,885.3 | -161,499.4 | -98,214.9 | 4,407.5 | -16,665.4 | -40,220.1 | -44,052.6 | -48,250.4 | -52,848.1 |
| WACC, % | 9.88 | 9.06 | 9.51 | 9.57 | 9.61 | 9.53 | 9.53 | 9.53 | 9.53 | 9.53 |
| PV UFCF | ||||||||||
| SUM PV UFCF | -149,326.9 | |||||||||
| Long Term Growth Rate, % | 3.00 | |||||||||
| Free cash flow (T + 1) | -54,434 | |||||||||
| Terminal Value | -833,908 | |||||||||
| Present Terminal Value | -529,056 | |||||||||
| Enterprise Value | -678,383 | |||||||||
| Net Debt | -132,776 | |||||||||
| Equity Value | -545,607 | |||||||||
| Diluted Shares Outstanding, MM | 167 | |||||||||
| Equity Value Per Share | -3,257.73 |
What You Will Receive
- Genuine KHI Financial Data: Pre-loaded with Kawasaki Heavy Industries’ historical and forecasted figures for accurate analysis.
- Fully Customizable Template: Easily adjust essential inputs such as revenue growth, WACC, and EBITDA %.
- Instant Calculations: Observe KHI's intrinsic value update in real-time as you make adjustments.
- Professional Valuation Tool: Crafted for investors, analysts, and consultants aiming for precise DCF outcomes.
- User-Friendly Interface: A straightforward layout with clear guidance suitable for all experience levels.
Key Features
- Customizable Forecast Inputs: Adjust essential parameters such as revenue growth, EBITDA %, and capital investments.
- Instant DCF Valuation: Automatically computes intrinsic value, NPV, and other financial metrics with ease.
- High-Precision Accuracy: Utilizes Kawasaki Heavy Industries' real financial data for dependable valuation results.
- Streamlined Scenario Analysis: Easily explore various assumptions and compare resulting outcomes.
- Efficient Valuation Tool: Avoid the hassle of constructing complex valuation models from the ground up.
How It Functions
- Step 1: Download the Excel file.
- Step 2: Review the pre-filled Kawasaki Heavy Industries data (historical and projected).
- Step 3: Modify key assumptions (highlighted in yellow) based on your analysis.
- Step 4: Observe automatic recalculations for Kawasaki Heavy Industries' intrinsic value.
- Step 5: Utilize the results for investment decisions or reporting.
Why Choose This Calculator for Kawasaki Heavy Industries, Ltd. (7012T)?
- User-Friendly Interface: Suitable for both newcomers and seasoned professionals.
- Adjustable Variables: Effortlessly alter inputs to suit your financial analysis.
- Real-Time Adjustments: Witness immediate changes in Kawasaki's valuation as you tweak inputs.
- Pre-Configured Data: Comes equipped with Kawasaki's actual financial figures for swift evaluations.
- Preferred by Experts: Valued by investors and analysts for informed decision-making.
Who Can Benefit from This Product?
- Investors: Utilize a professional-grade valuation tool to make informed investment choices with Kawasaki Heavy Industries, Ltd. (7012T).
- Financial Analysts: Streamline your workflow with a customizable DCF model tailored for Kawasaki Heavy Industries, Ltd. (7012T).
- Consultants: Effortlessly modify the template for client presentations or reports related to Kawasaki Heavy Industries, Ltd. (7012T).
- Finance Enthusiasts: Enhance your knowledge of valuation methods through practical examples involving Kawasaki Heavy Industries, Ltd. (7012T).
- Educators and Students: Employ it as an effective learning resource in finance courses focused on Kawasaki Heavy Industries, Ltd. (7012T).
Contents of the Template
- Pre-Filled Data: Contains Kawasaki Heavy Industries' historical financials and projections.
- Discounted Cash Flow Model: An editable DCF valuation model featuring automatic calculations.
- Weighted Average Cost of Capital (WACC): A specific sheet dedicated to calculating WACC using tailored inputs.
- Key Financial Ratios: Assess Kawasaki Heavy Industries' profitability, efficiency, and leverage metrics.
- Customizable Inputs: Easily modify revenue growth, margins, and tax rates.
- Clear Dashboard: Visual representations and tables summarizing essential valuation outcomes.
Disclaimer
All information, articles, and product details provided on this website are for general informational and educational purposes only. We do not claim any ownership over, nor do we intend to infringe upon, any trademarks, copyrights, logos, brand names, or other intellectual property mentioned or depicted on this site. Such intellectual property remains the property of its respective owners, and any references here are made solely for identification or informational purposes, without implying any affiliation, endorsement, or partnership.
We make no representations or warranties, express or implied, regarding the accuracy, completeness, or suitability of any content or products presented. Nothing on this website should be construed as legal, tax, investment, financial, medical, or other professional advice. In addition, no part of this site—including articles or product references—constitutes a solicitation, recommendation, endorsement, advertisement, or offer to buy or sell any securities, franchises, or other financial instruments, particularly in jurisdictions where such activity would be unlawful.
All content is of a general nature and may not address the specific circumstances of any individual or entity. It is not a substitute for professional advice or services. Any actions you take based on the information provided here are strictly at your own risk. You accept full responsibility for any decisions or outcomes arising from your use of this website and agree to release us from any liability in connection with your use of, or reliance upon, the content or products found herein.