
|
Hirogin Holdings, Inc. (7337.T) Avaliação DCF |
Totalmente Editável: Adapte-Se Às Suas Necessidades No Excel Ou Planilhas
Design Profissional: Modelos Confiáveis E Padrão Da Indústria
Pré-Construídos Para Uso Rápido E Eficiente
Compatível com MAC/PC, totalmente desbloqueado
Não É Necessária Experiência; Fácil De Seguir
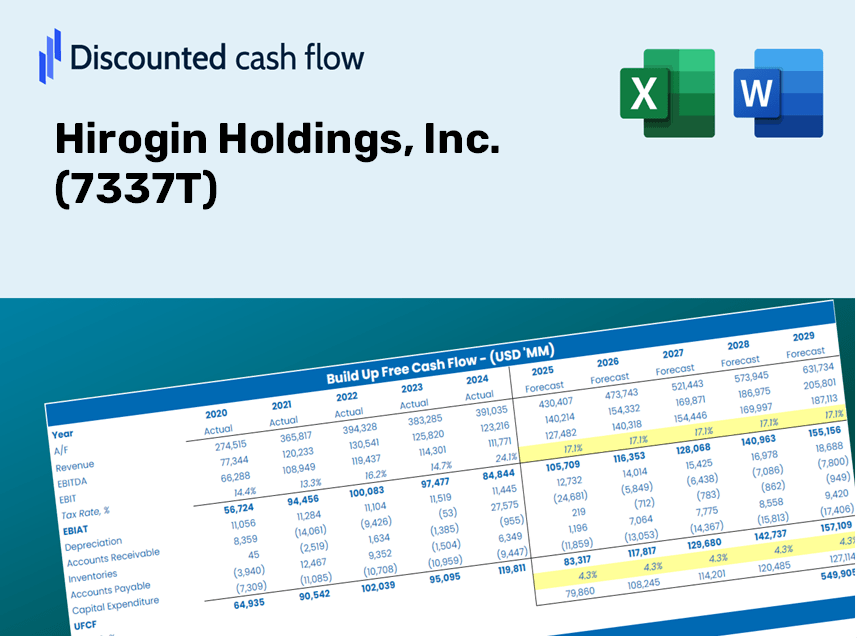
Hirogin Holdings, Inc. (7337.T) Bundle
Avalie as perspectivas financeiras da Hirogin Holdings, Inc. como um especialista! Esta calculadora DCF (7337T) fornece dados financeiros pré-preenchidos e permite que o controle total modifique o crescimento da receita, WACC, margens e outras suposições essenciais para se alinhar com suas previsões.
Discounted Cash Flow (DCF) - (USD MM)
| Year | AY1 2020 |
AY2 2021 |
AY3 2022 |
AY4 2023 |
AY5 2024 |
FY1 2025 |
FY2 2026 |
FY3 2027 |
FY4 2028 |
FY5 2029 |
|---|---|---|---|---|---|---|---|---|---|---|
| Revenue | 99,706.0 | 130,111.0 | 147,642.0 | 140,178.0 | 187,795.0 | 222,012.2 | 262,463.9 | 310,286.2 | 366,821.9 | 433,658.7 |
| Revenue Growth, % | 0 | 30.49 | 13.47 | -5.06 | 33.97 | 18.22 | 18.22 | 18.22 | 18.22 | 18.22 |
| EBITDA | 27,232.0 | 39,113.0 | 24,506.0 | 46,651.0 | 58,304.0 | 61,407.8 | 72,596.6 | 85,824.1 | 101,461.7 | 119,948.5 |
| EBITDA, % | 27.31 | 30.06 | 16.6 | 33.28 | 31.05 | 27.66 | 27.66 | 27.66 | 27.66 | 27.66 |
| Depreciation | .0 | 6,187.0 | 6,251.0 | 6,706.0 | 7,263.0 | 7,832.8 | 9,260.0 | 10,947.2 | 12,941.8 | 15,299.9 |
| Depreciation, % | 0 | 4.76 | 4.23 | 4.78 | 3.87 | 3.53 | 3.53 | 3.53 | 3.53 | 3.53 |
| EBIT | 27,232.0 | 32,926.0 | 18,255.0 | 39,945.0 | 51,041.0 | 53,575.0 | 63,336.6 | 74,876.9 | 88,519.8 | 104,648.6 |
| EBIT, % | 27.31 | 25.31 | 12.36 | 28.5 | 27.18 | 24.13 | 24.13 | 24.13 | 24.13 | 24.13 |
| Total Cash | 2,580,736.0 | 2,577,627.0 | 2,188,107.0 | 2,839,819.0 | 1,726,986.0 | 222,012.2 | 262,463.9 | 310,286.2 | 366,821.9 | 433,658.7 |
| Total Cash, percent | .0 | .0 | .0 | .0 | .0 | .0 | .0 | .0 | .0 | .0 |
| Account Receivables | .0 | .0 | .0 | .0 | .0 | .0 | .0 | .0 | .0 | .0 |
| Account Receivables, % | 0 | 0 | 0 | 0 | 0 | 0 | 0 | 0 | 0 | 0 |
| Inventories | .0 | .0 | .0 | .0 | .0 | .0 | .0 | .0 | .0 | .0 |
| Inventories, % | 0 | 0 | 0 | 0 | 0 | 0 | 0 | 0 | 0 | 0 |
| Accounts Payable | .0 | .0 | .0 | .0 | .0 | .0 | .0 | .0 | .0 | .0 |
| Accounts Payable, % | 0 | 0 | 0 | 0 | 0 | 0 | 0 | 0 | 0 | 0 |
| Capital Expenditure | -22,333.0 | -8,014.0 | -9,333.0 | -11,573.0 | -4,044.0 | -20,109.4 | -23,773.4 | -28,105.1 | -33,225.9 | -39,279.9 |
| Capital Expenditure, % | -22.4 | -6.16 | -6.32 | -8.26 | -2.15 | -9.06 | -9.06 | -9.06 | -9.06 | -9.06 |
| Tax Rate, % | 29.79 | 29.79 | 29.79 | 29.79 | 29.79 | 29.79 | 29.79 | 29.79 | 29.79 | 29.79 |
| EBITAT | 18,992.1 | 22,906.0 | 12,508.0 | 27,691.0 | 35,835.0 | 37,219.6 | 44,001.2 | 52,018.4 | 61,496.4 | 72,701.3 |
| Depreciation | ||||||||||
| Changes in Account Receivables | ||||||||||
| Changes in Inventories | ||||||||||
| Changes in Accounts Payable | ||||||||||
| Capital Expenditure | ||||||||||
| UFCF | -3,340.9 | 21,079.0 | 9,426.0 | 22,824.0 | 39,054.0 | 24,943.0 | 29,487.7 | 34,860.5 | 41,212.3 | 48,721.4 |
| WACC, % | 2.85 | 2.84 | 2.81 | 2.84 | 2.86 | 2.84 | 2.84 | 2.84 | 2.84 | 2.84 |
| PV UFCF | ||||||||||
| SUM PV UFCF | 163,378.8 | |||||||||
| Long Term Growth Rate, % | 2.00 | |||||||||
| Free cash flow (T + 1) | 49,696 | |||||||||
| Terminal Value | 5,904,253 | |||||||||
| Present Terminal Value | 5,132,380 | |||||||||
| Enterprise Value | 5,295,759 | |||||||||
| Net Debt | 27,555 | |||||||||
| Equity Value | 5,268,204 | |||||||||
| Diluted Shares Outstanding, MM | 302 | |||||||||
| Equity Value Per Share | 17,419.64 |
What You Will Receive
- Authentic 7337T Financial Data: Pre-loaded with Hirogin Holdings’ historical and forecasted information for accurate analysis.
- Completely Customizable Template: Effortlessly adjust essential inputs such as revenue growth, WACC, and EBITDA percentage.
- Real-Time Calculations: Watch the intrinsic value of Hirogin Holdings update immediately based on your modifications.
- Professional Valuation Tool: Tailored for investors, analysts, and consultants in need of reliable DCF outcomes.
- Intuitive Design: Streamlined layout and straightforward instructions suitable for all skill levels.
Key Features
- Comprehensive DCF Calculator: Features detailed unlevered and levered DCF valuation models tailored for Hirogin Holdings, Inc. (7337T).
- WACC Calculator: Pre-configured Weighted Average Cost of Capital sheet with user-friendly customizable inputs.
- Adjustable Forecast Assumptions: Easily modify growth rates, capital expenditures, and discount rates to suit your analysis.
- Integrated Financial Ratios: Evaluate profitability, leverage, and efficiency ratios specifically for Hirogin Holdings, Inc. (7337T).
- Interactive Dashboard and Charts: Visual representations of key valuation metrics for straightforward analysis.
How It Operates
- Download: Get the pre-built Excel file featuring Hirogin Holdings, Inc.'s (7337T) financial data.
- Customize: Modify projections, including revenue growth, EBITDA %, and WACC.
- Update Automatically: Benefit from real-time updates on intrinsic value and NPV calculations.
- Test Scenarios: Generate various projections and instantly compare the results.
- Make Decisions: Leverage the valuation insights to inform your investment approach.
Why Choose This Calculator?
- User-Friendly Interface: Perfectly crafted for both novices and seasoned professionals.
- Customizable Inputs: Effortlessly adjust parameters to tailor your analysis.
- Real-Time Updates: Instantly view changes to Hirogin Holdings, Inc.’s (7337T) valuation as you modify inputs.
- Preloaded Data: Comes with Hirogin Holdings, Inc.’s (7337T) actual financial statistics for immediate analysis.
- Preferred by Experts: Widely utilized by investors and analysts for making data-driven decisions.
Who Can Benefit from This Product?
- Investors: Evaluate Hirogin Holdings, Inc.'s (7337T) valuation prior to making investment decisions.
- CFOs and Financial Analysts: Enhance valuation workflows and validate financial forecasts.
- Startup Founders: Understand the valuation methods used for established companies like Hirogin Holdings, Inc. (7337T).
- Consultants: Create comprehensive valuation reports to meet client needs.
- Students and Educators: Utilize real-world examples to practice and teach valuation methodologies.
What the Template Includes
- Historical Data: Comprises Hirogin Holdings, Inc.'s (7337T) previous financial statements and foundational forecasts.
- DCF and Levered DCF Models: Comprehensive templates designed to estimate the intrinsic value of Hirogin Holdings, Inc. (7337T).
- WACC Sheet: Pre-configured calculations for the Weighted Average Cost of Capital.
- Editable Inputs: Adjust essential drivers such as growth rates, EBITDA percentages, and CAPEX assumptions.
- Quarterly and Annual Statements: A thorough analysis of Hirogin Holdings, Inc.'s (7337T) financial performance.
- Interactive Dashboard: Dynamically visualize valuation outcomes and future projections.
Disclaimer
All information, articles, and product details provided on this website are for general informational and educational purposes only. We do not claim any ownership over, nor do we intend to infringe upon, any trademarks, copyrights, logos, brand names, or other intellectual property mentioned or depicted on this site. Such intellectual property remains the property of its respective owners, and any references here are made solely for identification or informational purposes, without implying any affiliation, endorsement, or partnership.
We make no representations or warranties, express or implied, regarding the accuracy, completeness, or suitability of any content or products presented. Nothing on this website should be construed as legal, tax, investment, financial, medical, or other professional advice. In addition, no part of this site—including articles or product references—constitutes a solicitation, recommendation, endorsement, advertisement, or offer to buy or sell any securities, franchises, or other financial instruments, particularly in jurisdictions where such activity would be unlawful.
All content is of a general nature and may not address the specific circumstances of any individual or entity. It is not a substitute for professional advice or services. Any actions you take based on the information provided here are strictly at your own risk. You accept full responsibility for any decisions or outcomes arising from your use of this website and agree to release us from any liability in connection with your use of, or reliance upon, the content or products found herein.