
|
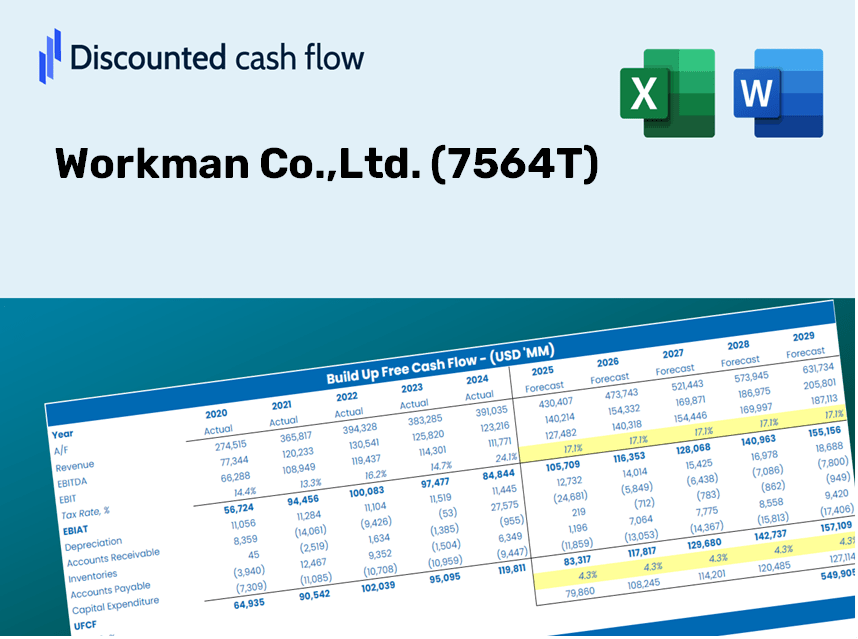
Workman Co., Ltd. (7564.T) Avaliação do DCF |
Totalmente Editável: Adapte-Se Às Suas Necessidades No Excel Ou Planilhas
Design Profissional: Modelos Confiáveis E Padrão Da Indústria
Pré-Construídos Para Uso Rápido E Eficiente
Compatível com MAC/PC, totalmente desbloqueado
Não É Necessária Experiência; Fácil De Seguir
Workman Co.,Ltd. (7564.T) Bundle
Projetado para precisão, nossa calculadora DCF (7564T) capacita você a avaliar a avaliação Workman Co., Ltd. Usando dados financeiros do mundo real e permite a flexibilidade completa para modificar todos os parâmetros essenciais para projeções aprimoradas.
Discounted Cash Flow (DCF) - (USD MM)
| Year | AY1 2020 |
AY2 2021 |
AY3 2022 |
AY4 2023 |
AY5 2024 |
FY1 2025 |
FY2 2026 |
FY3 2027 |
FY4 2028 |
FY5 2029 |
|---|---|---|---|---|---|---|---|---|---|---|
| Revenue | 105,814.0 | 116,263.0 | 128,288.0 | 132,649.0 | 136,933.0 | 146,123.5 | 155,930.9 | 166,396.5 | 177,564.5 | 189,482.1 |
| Revenue Growth, % | 0 | 9.87 | 10.34 | 3.4 | 3.23 | 6.71 | 6.71 | 6.71 | 6.71 | 6.71 |
| EBITDA | 27,088.0 | 29,405.0 | 27,037.0 | 26,444.0 | 27,976.0 | 32,828.8 | 35,032.2 | 37,383.4 | 39,892.5 | 42,570.0 |
| EBITDA, % | 25.6 | 25.29 | 21.08 | 19.94 | 20.43 | 22.47 | 22.47 | 22.47 | 22.47 | 22.47 |
| Depreciation | 1,677.0 | 2,042.0 | 2,341.0 | 2,773.0 | 3,054.0 | 2,772.5 | 2,958.6 | 3,157.1 | 3,369.0 | 3,595.2 |
| Depreciation, % | 1.58 | 1.76 | 1.82 | 2.09 | 2.23 | 1.9 | 1.9 | 1.9 | 1.9 | 1.9 |
| EBIT | 25,411.0 | 27,363.0 | 24,696.0 | 23,671.0 | 24,922.0 | 30,056.3 | 32,073.6 | 34,226.3 | 36,523.5 | 38,974.8 |
| EBIT, % | 24.01 | 23.54 | 19.25 | 17.84 | 18.2 | 20.57 | 20.57 | 20.57 | 20.57 | 20.57 |
| Total Cash | 57,813.0 | 64,283.0 | 62,640.0 | 68,187.0 | 80,381.0 | 78,573.6 | 83,847.2 | 89,474.8 | 95,480.0 | 101,888.4 |
| Total Cash, percent | .0 | .0 | .0 | .0 | .0 | .0 | .0 | .0 | .0 | .0 |
| Account Receivables | 12,719.0 | 13,188.0 | 15,485.0 | 17,011.0 | 15,794.0 | 17,474.1 | 18,646.9 | 19,898.4 | 21,233.9 | 22,659.1 |
| Account Receivables, % | 12.02 | 11.34 | 12.07 | 12.82 | 11.53 | 11.96 | 11.96 | 11.96 | 11.96 | 11.96 |
| Inventories | 14,098.0 | 15,282.0 | 21,946.0 | 25,298.0 | 24,115.0 | 23,454.8 | 25,029.0 | 26,708.9 | 28,501.5 | 30,414.4 |
| Inventories, % | 13.32 | 13.14 | 17.11 | 19.07 | 17.61 | 16.05 | 16.05 | 16.05 | 16.05 | 16.05 |
| Accounts Payable | 5,789.0 | 6,840.0 | 7,167.0 | 7,205.0 | 8,851.0 | 8,427.3 | 8,992.9 | 9,596.5 | 10,240.6 | 10,927.9 |
| Accounts Payable, % | 5.47 | 5.88 | 5.59 | 5.43 | 6.46 | 5.77 | 5.77 | 5.77 | 5.77 | 5.77 |
| Capital Expenditure | -4,612.0 | -6,664.0 | -4,654.0 | -3,859.0 | -6,221.0 | -6,187.0 | -6,602.3 | -7,045.4 | -7,518.3 | -8,022.9 |
| Capital Expenditure, % | -4.36 | -5.73 | -3.63 | -2.91 | -4.54 | -4.23 | -4.23 | -4.23 | -4.23 | -4.23 |
| Tax Rate, % | 32.13 | 32.13 | 32.13 | 32.13 | 32.13 | 32.13 | 32.13 | 32.13 | 32.13 | 32.13 |
| EBITAT | 17,076.0 | 18,336.5 | 16,683.7 | 16,009.7 | 16,913.7 | 20,274.1 | 21,634.8 | 23,086.9 | 24,636.4 | 26,289.9 |
| Depreciation | ||||||||||
| Changes in Account Receivables | ||||||||||
| Changes in Inventories | ||||||||||
| Changes in Accounts Payable | ||||||||||
| Capital Expenditure | ||||||||||
| UFCF | -6,887.0 | 13,112.5 | 5,736.7 | 10,083.7 | 17,792.7 | 15,416.0 | 15,809.7 | 16,870.8 | 18,003.1 | 19,211.4 |
| WACC, % | 5.89 | 5.89 | 5.89 | 5.89 | 5.89 | 5.89 | 5.89 | 5.89 | 5.89 | 5.89 |
| PV UFCF | ||||||||||
| SUM PV UFCF | 71,617.1 | |||||||||
| Long Term Growth Rate, % | 2.00 | |||||||||
| Free cash flow (T + 1) | 19,596 | |||||||||
| Terminal Value | 503,703 | |||||||||
| Present Terminal Value | 378,350 | |||||||||
| Enterprise Value | 449,967 | |||||||||
| Net Debt | -78,574 | |||||||||
| Equity Value | 528,541 | |||||||||
| Diluted Shares Outstanding, MM | 82 | |||||||||
| Equity Value Per Share | 6,476.42 |
What You Will Receive
- Adjustable Forecast Assumptions: Effortlessly modify key variables (growth %, margins, WACC) to explore various scenarios.
- Industry Data: Pre-populated financial data for Workman Co., Ltd. (7564T) to kickstart your analysis.
- Instant DCF Calculations: The template automatically computes Net Present Value (NPV) and intrinsic value for you.
- Tailored and Professional Design: A sleek Excel model that customizes to fit your valuation requirements.
- Engineered for Analysts and Investors: Perfect for evaluating projections, confirming strategies, and enhancing efficiency.
Key Features
- Pre-Loaded Data: Workman Co., Ltd.’s historical financial statements and pre-filled forecasts.
- Fully Customizable Inputs: Adjust WACC, tax rates, revenue growth, and EBITDA margins as needed.
- Real-Time Results: Watch the intrinsic value of Workman Co., Ltd. (7564T) update instantly.
- Intuitive Visual Outputs: Dashboard charts showcase valuation results and essential metrics.
- Designed for Precision: A professional-grade tool for analysts, investors, and finance professionals.
How It Functions
- Download the Template: Gain immediate access to the Excel-based Workman Co.,Ltd. (7564T) DCF Calculator.
- Enter Your Assumptions: Modify the yellow-highlighted cells for growth rates, WACC, margins, and other parameters.
- Immediate Calculations: The model automatically recalculates Workman Co.,Ltd. (7564T)’s intrinsic value.
- Explore Scenarios: Simulate various assumptions to assess potential changes in valuation.
- Analyze and Make Decisions: Leverage the findings to inform your investment or financial analysis.
Why Choose This Calculator for Workman Co., Ltd. (7564T)?
- User-Friendly Interface: Crafted for both novices and seasoned professionals.
- Customizable Inputs: Effortlessly adjust parameters to suit your financial analysis.
- Real-Time Valuation: Witness immediate updates to Workman Co., Ltd.'s valuation as you make changes.
- Pre-Loaded Data: Comes equipped with Workman Co., Ltd.'s latest financial information for swift evaluations.
- Preferred by Experts: Trusted by analysts and investors for making well-informed choices.
Who Should Benefit from Workman Co.,Ltd. (7564T)?
- Retail Investors: Gain insights to make informed choices on purchasing or selling Workman Co.,Ltd. (7564T) shares.
- Market Analysts: Enhance analysis workflows with comprehensive financial models tailored for Workman Co.,Ltd. (7564T).
- Advisors: Provide accurate valuation assessments to clients in a timely manner.
- Entrepreneurs: Learn how established companies like Workman Co.,Ltd. (7564T) are appraised to inform your business strategies.
- Finance Students: Acquire valuation skills using actual data and applicable case studies related to Workman Co.,Ltd. (7564T).
Contents of the Template
- Pre-Filled Data: Contains Workman Co., Ltd.'s historical financials and projections.
- Discounted Cash Flow Model: An editable DCF valuation model with automatic calculations included.
- Weighted Average Cost of Capital (WACC): A dedicated sheet for calculating WACC using custom inputs.
- Key Financial Ratios: Evaluate Workman Co., Ltd.'s profitability, efficiency, and leverage.
- Customizable Inputs: Easily edit revenue growth, margins, and tax rates.
- Clear Dashboard: Charts and tables that summarize key valuation results.
Disclaimer
All information, articles, and product details provided on this website are for general informational and educational purposes only. We do not claim any ownership over, nor do we intend to infringe upon, any trademarks, copyrights, logos, brand names, or other intellectual property mentioned or depicted on this site. Such intellectual property remains the property of its respective owners, and any references here are made solely for identification or informational purposes, without implying any affiliation, endorsement, or partnership.
We make no representations or warranties, express or implied, regarding the accuracy, completeness, or suitability of any content or products presented. Nothing on this website should be construed as legal, tax, investment, financial, medical, or other professional advice. In addition, no part of this site—including articles or product references—constitutes a solicitation, recommendation, endorsement, advertisement, or offer to buy or sell any securities, franchises, or other financial instruments, particularly in jurisdictions where such activity would be unlawful.
All content is of a general nature and may not address the specific circumstances of any individual or entity. It is not a substitute for professional advice or services. Any actions you take based on the information provided here are strictly at your own risk. You accept full responsibility for any decisions or outcomes arising from your use of this website and agree to release us from any liability in connection with your use of, or reliance upon, the content or products found herein.