
|
Mani, Inc. (7730.T) Avaliação DCF |
Totalmente Editável: Adapte-Se Às Suas Necessidades No Excel Ou Planilhas
Design Profissional: Modelos Confiáveis E Padrão Da Indústria
Pré-Construídos Para Uso Rápido E Eficiente
Compatível com MAC/PC, totalmente desbloqueado
Não É Necessária Experiência; Fácil De Seguir
Mani, Inc. (7730.T) Bundle
Descubra o verdadeiro valor da Mani, Inc. (7730T) com nossa calculadora DCF de nível profissional! Ajuste as principais suposições, explore vários cenários e avalie como as mudanças afetam a avaliação Mani, Inc. (7730T) - tudo dentro de um único modelo do Excel.
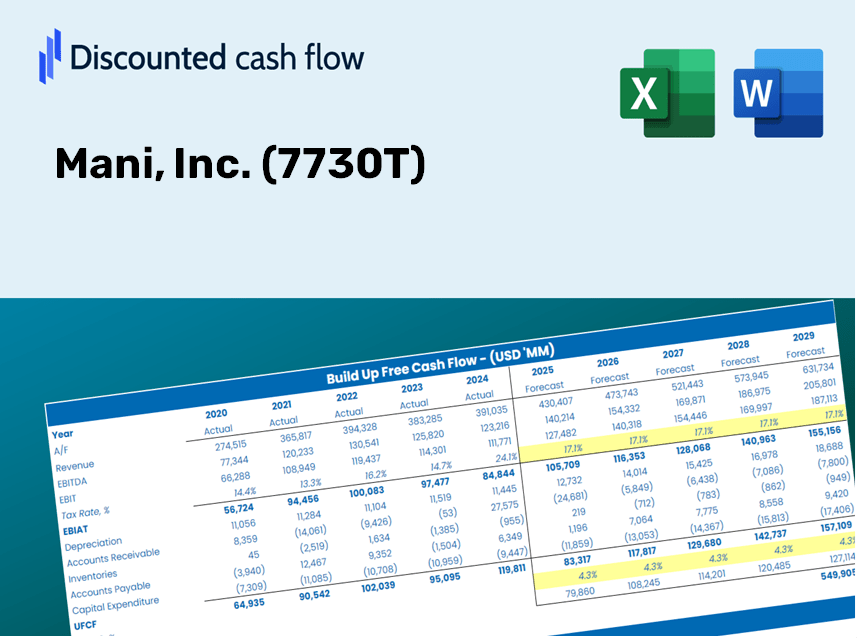
Discounted Cash Flow (DCF) - (USD MM)
| Year | AY1 2020 |
AY2 2021 |
AY3 2022 |
AY4 2023 |
AY5 2024 |
FY1 2025 |
FY2 2026 |
FY3 2027 |
FY4 2028 |
FY5 2029 |
|---|---|---|---|---|---|---|---|---|---|---|
| Revenue | 15,200.2 | 17,190.0 | 20,416.0 | 24,488.0 | 28,513.0 | 33,377.3 | 39,071.4 | 45,736.9 | 53,539.5 | 62,673.2 |
| Revenue Growth, % | 0 | 13.09 | 18.77 | 19.95 | 16.44 | 17.06 | 17.06 | 17.06 | 17.06 | 17.06 |
| EBITDA | 6,261.5 | 7,546.0 | 9,168.0 | 9,940.0 | 10,699.0 | 13,892.4 | 16,262.4 | 19,036.7 | 22,284.4 | 26,086.0 |
| EBITDA, % | 41.19 | 43.9 | 44.91 | 40.59 | 37.52 | 41.62 | 41.62 | 41.62 | 41.62 | 41.62 |
| Depreciation | 1,411.7 | 1,541.0 | 1,745.0 | 1,917.0 | 2,270.0 | 2,843.0 | 3,328.0 | 3,895.8 | 4,560.4 | 5,338.3 |
| Depreciation, % | 9.29 | 8.96 | 8.55 | 7.83 | 7.96 | 8.52 | 8.52 | 8.52 | 8.52 | 8.52 |
| EBIT | 4,849.8 | 6,005.0 | 7,423.0 | 8,023.0 | 8,429.0 | 11,049.4 | 12,934.4 | 15,141.0 | 17,724.0 | 20,747.7 |
| EBIT, % | 31.91 | 34.93 | 36.36 | 32.76 | 29.56 | 33.1 | 33.1 | 33.1 | 33.1 | 33.1 |
| Total Cash | 17,175.4 | 18,895.0 | 22,729.0 | 25,427.0 | 21,662.0 | 31,773.3 | 37,193.8 | 43,539.0 | 50,966.6 | 59,661.5 |
| Total Cash, percent | .0 | .0 | .0 | .0 | .0 | .0 | .0 | .0 | .0 | .0 |
| Account Receivables | 1,575.0 | 1,899.0 | 2,140.0 | 2,322.0 | 2,906.0 | 3,442.2 | 4,029.4 | 4,716.8 | 5,521.5 | 6,463.5 |
| Account Receivables, % | 10.36 | 11.05 | 10.48 | 9.48 | 10.19 | 10.31 | 10.31 | 10.31 | 10.31 | 10.31 |
| Inventories | 6,644.9 | 6,465.0 | 6,479.0 | 6,419.0 | 6,361.0 | 10,786.3 | 12,626.4 | 14,780.5 | 17,302.0 | 20,253.7 |
| Inventories, % | 43.72 | 37.61 | 31.73 | 26.21 | 22.31 | 32.32 | 32.32 | 32.32 | 32.32 | 32.32 |
| Accounts Payable | 149.0 | 156.0 | 111.0 | 159.0 | 181.0 | 248.0 | 290.3 | 339.9 | 397.9 | 465.7 |
| Accounts Payable, % | 0.98025 | 0.9075 | 0.54369 | 0.6493 | 0.6348 | 0.74311 | 0.74311 | 0.74311 | 0.74311 | 0.74311 |
| Capital Expenditure | -1,692.5 | -3,861.0 | -1,944.0 | -3,720.0 | -7,681.0 | -5,690.6 | -6,661.5 | -7,797.9 | -9,128.2 | -10,685.5 |
| Capital Expenditure, % | -11.13 | -22.46 | -9.52 | -15.19 | -26.94 | -17.05 | -17.05 | -17.05 | -17.05 | -17.05 |
| Tax Rate, % | 25.38 | 25.38 | 25.38 | 25.38 | 25.38 | 25.38 | 25.38 | 25.38 | 25.38 | 25.38 |
| EBITAT | 3,341.4 | 4,293.9 | 5,292.9 | 5,956.7 | 6,289.7 | 7,968.2 | 9,327.6 | 10,918.8 | 12,781.6 | 14,962.1 |
| Depreciation | ||||||||||
| Changes in Account Receivables | ||||||||||
| Changes in Inventories | ||||||||||
| Changes in Accounts Payable | ||||||||||
| Capital Expenditure | ||||||||||
| UFCF | -5,010.3 | 1,836.7 | 4,793.9 | 4,079.7 | 374.7 | 226.1 | 3,609.1 | 4,224.8 | 4,945.5 | 5,789.2 |
| WACC, % | 4.53 | 4.53 | 4.53 | 4.53 | 4.53 | 4.53 | 4.53 | 4.53 | 4.53 | 4.53 |
| PV UFCF | ||||||||||
| SUM PV UFCF | 15,997.1 | |||||||||
| Long Term Growth Rate, % | 3.00 | |||||||||
| Free cash flow (T + 1) | 5,963 | |||||||||
| Terminal Value | 388,617 | |||||||||
| Present Terminal Value | 311,334 | |||||||||
| Enterprise Value | 327,331 | |||||||||
| Net Debt | -21,561 | |||||||||
| Equity Value | 348,892 | |||||||||
| Diluted Shares Outstanding, MM | 98 | |||||||||
| Equity Value Per Share | 3,542.20 |
Benefits of Choosing Mani, Inc. (7730T)
- Comprehensive Financial Model: Leverage Mani, Inc.’s actual performance data for accurate DCF valuations.
- Complete Forecasting Flexibility: Modify key metrics like revenue growth, profit margins, WACC, and more.
- Real-Time Calculations: Receive instant updates on your valuations as you make adjustments.
- Professional-Grade Template: An expert-designed Excel file ideal for investor presentations.
- Adaptable and Reusable: Custom-built for versatility, facilitating ongoing detailed forecasting.
Key Features
- Comprehensive DCF Calculator: Features detailed unlevered and levered DCF valuation models tailored for Mani, Inc. (7730T).
- WACC Analysis Tool: Comes with a pre-configured Weighted Average Cost of Capital sheet, allowing for customizable inputs.
- Adjustable Forecast Parameters: Easily modify growth projections, capital expenditures, and discount rates.
- Integrated Financial Ratios: Evaluate profitability, leverage, and efficiency ratios specifically for Mani, Inc. (7730T).
- User-Friendly Dashboard and Charts: Visual representations summarize essential valuation metrics for straightforward analysis.
How It Functions
- Step 1: Download the prebuilt Excel template featuring Mani, Inc.'s (7730T) data.
- Step 2: Review the pre-filled sheets to familiarize yourself with the essential metrics.
- Step 3: Modify forecasts and assumptions in the editable yellow cells (WACC, growth, margins).
- Step 4: Instantly see the recalculated results, including the intrinsic value of Mani, Inc. (7730T).
- Step 5: Utilize the outputs to make informed investment choices or generate detailed reports.
Why Opt for Mani, Inc. (7730T) Calculator?
- Reliable Data: Use verified financial metrics from Mani, Inc. for trustworthy valuation insights.
- Flexible Customization: Tailor essential variables such as growth rates, WACC, and tax rates to fit your expectations.
- Efficient: Built-in calculations save you the hassle of starting from the ground up.
- Professional-Quality Tool: Crafted for investors, analysts, and consultants in mind.
- Easy to Use: User-friendly design and clear step-by-step guidance accessible for everyone.
Who Can Benefit from This Product?
- Institutional Investors: Develop comprehensive and trustworthy valuation models for asset assessment.
- Finance Departments: Evaluate valuation scenarios to inform corporate decision-making.
- Consultants and Financial Advisors: Deliver precise valuation insights for Mani, Inc. (7730T) to your clients.
- Academics and Learners: Utilize real-world data for hands-on practice and instruction in financial modeling.
- Business Enthusiasts: Gain insights into the valuation process of companies like Mani, Inc. (7730T) within the tech industry.
Contents of the Template
- Pre-Filled Data: Contains Mani, Inc.'s (7730T) historical financial performance and projections.
- Discounted Cash Flow Model: An editable DCF valuation model with automatic computation features.
- Weighted Average Cost of Capital (WACC): A dedicated section for WACC calculations based on user-defined inputs.
- Key Financial Ratios: Evaluate Mani, Inc.'s (7730T) profitability, efficiency, and leverage metrics.
- Customizable Inputs: Easily modify revenue growth rates, profit margins, and tax percentages.
- Clear Dashboard: Visual summaries through charts and tables that highlight essential valuation outcomes.
Disclaimer
All information, articles, and product details provided on this website are for general informational and educational purposes only. We do not claim any ownership over, nor do we intend to infringe upon, any trademarks, copyrights, logos, brand names, or other intellectual property mentioned or depicted on this site. Such intellectual property remains the property of its respective owners, and any references here are made solely for identification or informational purposes, without implying any affiliation, endorsement, or partnership.
We make no representations or warranties, express or implied, regarding the accuracy, completeness, or suitability of any content or products presented. Nothing on this website should be construed as legal, tax, investment, financial, medical, or other professional advice. In addition, no part of this site—including articles or product references—constitutes a solicitation, recommendation, endorsement, advertisement, or offer to buy or sell any securities, franchises, or other financial instruments, particularly in jurisdictions where such activity would be unlawful.
All content is of a general nature and may not address the specific circumstances of any individual or entity. It is not a substitute for professional advice or services. Any actions you take based on the information provided here are strictly at your own risk. You accept full responsibility for any decisions or outcomes arising from your use of this website and agree to release us from any liability in connection with your use of, or reliance upon, the content or products found herein.