
|
Riken Keiki Co., Ltd. (7734.t) Avaliação DCF |
Totalmente Editável: Adapte-Se Às Suas Necessidades No Excel Ou Planilhas
Design Profissional: Modelos Confiáveis E Padrão Da Indústria
Pré-Construídos Para Uso Rápido E Eficiente
Compatível com MAC/PC, totalmente desbloqueado
Não É Necessária Experiência; Fácil De Seguir
Riken Keiki Co., Ltd. (7734.T) Bundle
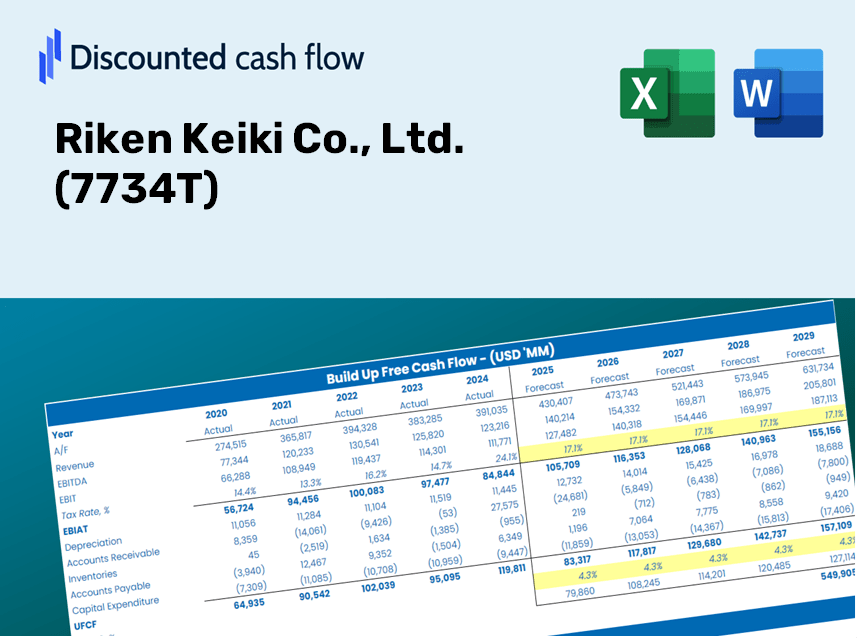
Master Your Riken Keiki Co., Ltd. (7734T) Análise de avaliação com nossa sofisticada calculadora DCF! Pré -carregado com dados reais (7734T), este modelo do Excel permite ajustar as previsões e suposições para determinar com precisão o valor intrínseco da Riken Keiki Co., Ltd.
Discounted Cash Flow (DCF) - (USD MM)
| Year | AY1 2020 |
AY2 2021 |
AY3 2022 |
AY4 2023 |
AY5 2024 |
FY1 2025 |
FY2 2026 |
FY3 2027 |
FY4 2028 |
FY5 2029 |
|---|---|---|---|---|---|---|---|---|---|---|
| Revenue | 32,209.3 | 37,364.0 | 45,004.8 | 45,581.4 | 49,038.9 | 54,595.1 | 60,780.7 | 67,667.2 | 75,333.9 | 83,869.2 |
| Revenue Growth, % | 0 | 16 | 20.45 | 1.28 | 7.59 | 11.33 | 11.33 | 11.33 | 11.33 | 11.33 |
| EBITDA | 8,223.6 | 10,730.0 | 13,712.3 | 14,312.3 | 13,462.6 | 15,676.4 | 17,452.6 | 19,430.0 | 21,631.4 | 24,082.2 |
| EBITDA, % | 25.53 | 28.72 | 30.47 | 31.4 | 27.45 | 28.71 | 28.71 | 28.71 | 28.71 | 28.71 |
| Depreciation | 1,529.8 | 1,855.5 | 1,917.4 | 1,971.1 | 2,061.8 | 2,457.3 | 2,735.7 | 3,045.7 | 3,390.7 | 3,774.9 |
| Depreciation, % | 4.75 | 4.97 | 4.26 | 4.32 | 4.2 | 4.5 | 4.5 | 4.5 | 4.5 | 4.5 |
| EBIT | 6,693.8 | 8,874.5 | 11,794.9 | 12,341.3 | 11,400.8 | 13,219.2 | 14,716.9 | 16,384.3 | 18,240.7 | 20,307.3 |
| EBIT, % | 20.78 | 23.75 | 26.21 | 27.08 | 23.25 | 24.21 | 24.21 | 24.21 | 24.21 | 24.21 |
| Total Cash | 15,926.3 | 21,503.5 | 22,019.4 | 21,591.0 | 23,248.7 | 27,374.1 | 30,475.6 | 33,928.4 | 37,772.5 | 42,052.2 |
| Total Cash, percent | .0 | .0 | .0 | .0 | .0 | .0 | .0 | .0 | .0 | .0 |
| Account Receivables | 12,693.1 | 12,714.4 | 14,148.7 | 15,116.9 | 16,349.9 | 18,713.0 | 20,833.2 | 23,193.6 | 25,821.5 | 28,747.0 |
| Account Receivables, % | 39.41 | 34.03 | 31.44 | 33.16 | 33.34 | 34.28 | 34.28 | 34.28 | 34.28 | 34.28 |
| Inventories | 5,406.2 | 8,443.3 | 14,156.3 | 19,342.8 | 19,226.6 | 16,649.3 | 18,535.6 | 20,635.7 | 22,973.7 | 25,576.7 |
| Inventories, % | 16.78 | 22.6 | 31.46 | 42.44 | 39.21 | 30.5 | 30.5 | 30.5 | 30.5 | 30.5 |
| Accounts Payable | 3,206.8 | 4,093.9 | 5,201.3 | 4,718.2 | 2,927.1 | 5,327.4 | 5,931.0 | 6,603.0 | 7,351.1 | 8,184.0 |
| Accounts Payable, % | 9.96 | 10.96 | 11.56 | 10.35 | 5.97 | 9.76 | 9.76 | 9.76 | 9.76 | 9.76 |
| Capital Expenditure | -2,784.3 | -859.4 | -1,110.7 | -2,634.7 | -832.3 | -2,280.9 | -2,539.4 | -2,827.1 | -3,147.4 | -3,504.0 |
| Capital Expenditure, % | -8.64 | -2.3 | -2.47 | -5.78 | -1.7 | -4.18 | -4.18 | -4.18 | -4.18 | -4.18 |
| Tax Rate, % | 29.44 | 29.44 | 29.44 | 29.44 | 29.44 | 29.44 | 29.44 | 29.44 | 29.44 | 29.44 |
| EBITAT | 4,715.8 | 5,995.9 | 8,700.5 | 8,407.9 | 8,044.6 | 9,265.8 | 10,315.6 | 11,484.4 | 12,785.5 | 14,234.1 |
| Depreciation | ||||||||||
| Changes in Account Receivables | ||||||||||
| Changes in Inventories | ||||||||||
| Changes in Accounts Payable | ||||||||||
| Capital Expenditure | ||||||||||
| UFCF | -11,431.1 | 4,820.7 | 3,467.4 | 1,106.5 | 6,366.1 | 12,056.7 | 7,109.0 | 7,914.4 | 8,811.1 | 9,809.4 |
| WACC, % | 7.91 | 7.91 | 7.91 | 7.91 | 7.91 | 7.91 | 7.91 | 7.91 | 7.91 | 7.91 |
| PV UFCF | ||||||||||
| SUM PV UFCF | 36,777.3 | |||||||||
| Long Term Growth Rate, % | 2.00 | |||||||||
| Free cash flow (T + 1) | 10,006 | |||||||||
| Terminal Value | 169,266 | |||||||||
| Present Terminal Value | 115,674 | |||||||||
| Enterprise Value | 152,452 | |||||||||
| Net Debt | -14,990 | |||||||||
| Equity Value | 167,442 | |||||||||
| Diluted Shares Outstanding, MM | 47 | |||||||||
| Equity Value Per Share | 3,598.66 |
What You Can Expect
- Authentic Riken Keiki Data: Comprehensive financial information – from sales to EBIT – based on real and forecasted data.
- Complete Customization: Modify all essential parameters (yellow cells) such as WACC, growth %, and tax rates.
- Immediate Valuation Adjustments: Automatic updates to evaluate the effects of changes on Riken Keiki's fair value.
- Flexible Excel Template: Designed for quick modifications, scenario analyses, and detailed forecasting.
- Efficient and Precise: Eliminate the need to create models from the ground up while ensuring accuracy and adaptability.
Key Features
- Genuine Financial Data: Gain access to reliable historical figures and future forecasts specific to Riken Keiki Co., Ltd. (7734T).
- Adjustable Forecast Assumptions: Modify highlighted cells for parameters such as WACC, growth rates, and profit margins.
- Real-Time Calculations: Automatic recalculation of DCF, Net Present Value (NPV), and cash flow assessments.
- User-Friendly Dashboard: Clear charts and summaries for easy visualization of your valuation outcomes.
- Suitable for All Levels: A straightforward, user-friendly design tailored for investors, CFOs, and consultants alike.
How it Operates
- Step 1: Download the Excel workbook.
- Step 2: Examine the pre-populated Riken Keiki Co., Ltd. (7734T) data (both historical and forecasted).
- Step 3: Modify key assumptions (highlighted in yellow) based on your analysis.
- Step 4: Observe real-time updates on Riken Keiki Co., Ltd.’s intrinsic value.
- Step 5: Utilize the results for investment choices or reporting purposes.
Why Select This Calculator for Riken Keiki Co., Ltd. (7734T)?
- User-Friendly and Accessible: Perfectly tailored for both novices and seasoned analysts.
- Customizable Inputs: Easily adjust parameters to suit your specific analysis.
- Real-Time Feedback: Observe immediate updates to Riken Keiki’s valuation as you change the inputs.
- Preconfigured with Data: Comes equipped with Riken Keiki’s latest financial figures for swift evaluations.
- Relied Upon by Experts: A go-to tool for investors and analysts seeking to make well-informed choices.
Who Can Benefit from Riken Keiki Co., Ltd. (7734T)?
- Investors: Enhance your investment strategies with a reliable valuation tool tailored for Riken Keiki Co., Ltd. (7734T).
- Financial Analysts: Streamline your analysis process using a customizable DCF model designed for efficiency.
- Consultants: Effortlessly modify the template to meet the needs of client presentations and reports.
- Finance Enthusiasts: Expand your knowledge of valuation methods through practical examples related to Riken Keiki Co., Ltd. (7734T).
- Educators and Students: Utilize this resource as a hands-on learning tool in finance courses focused on corporate valuation.
Contents of the Template
- Pre-Filled DCF Model: Riken Keiki Co., Ltd.'s financial data preloaded for immediate application.
- WACC Calculator: Comprehensive calculations for Weighted Average Cost of Capital.
- Financial Ratios: Assess Riken Keiki's profitability, leverage, and operational efficiency.
- Editable Inputs: Customize assumptions like growth rates, margins, and CAPEX based on your scenarios.
- Financial Statements: Annual and quarterly reports to facilitate in-depth analysis.
- Interactive Dashboard: Effortlessly visualize essential valuation metrics and outcomes.
Disclaimer
All information, articles, and product details provided on this website are for general informational and educational purposes only. We do not claim any ownership over, nor do we intend to infringe upon, any trademarks, copyrights, logos, brand names, or other intellectual property mentioned or depicted on this site. Such intellectual property remains the property of its respective owners, and any references here are made solely for identification or informational purposes, without implying any affiliation, endorsement, or partnership.
We make no representations or warranties, express or implied, regarding the accuracy, completeness, or suitability of any content or products presented. Nothing on this website should be construed as legal, tax, investment, financial, medical, or other professional advice. In addition, no part of this site—including articles or product references—constitutes a solicitation, recommendation, endorsement, advertisement, or offer to buy or sell any securities, franchises, or other financial instruments, particularly in jurisdictions where such activity would be unlawful.
All content is of a general nature and may not address the specific circumstances of any individual or entity. It is not a substitute for professional advice or services. Any actions you take based on the information provided here are strictly at your own risk. You accept full responsibility for any decisions or outcomes arising from your use of this website and agree to release us from any liability in connection with your use of, or reliance upon, the content or products found herein.