
|
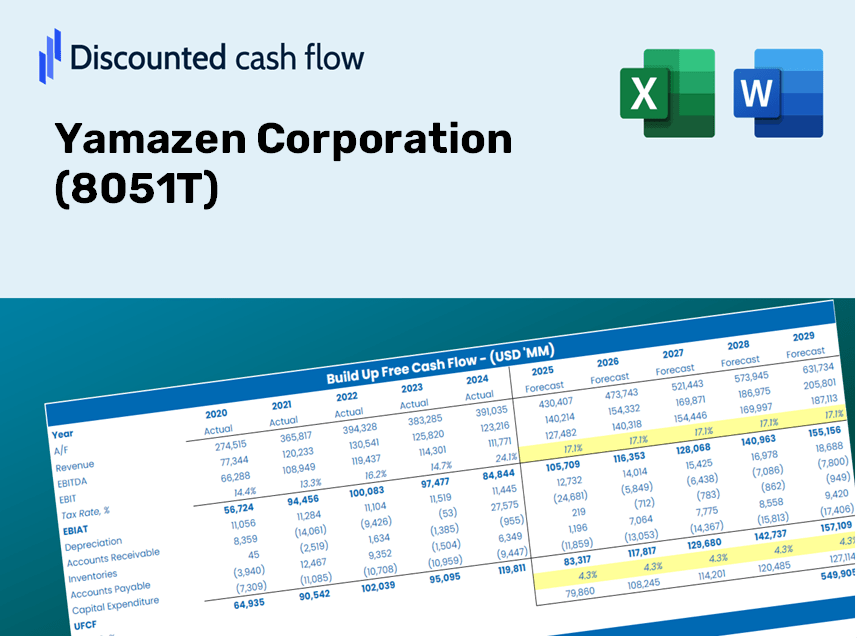
Avaliação DCF da Corporação Yamazen (8051.T) |
Totalmente Editável: Adapte-Se Às Suas Necessidades No Excel Ou Planilhas
Design Profissional: Modelos Confiáveis E Padrão Da Indústria
Pré-Construídos Para Uso Rápido E Eficiente
Compatível com MAC/PC, totalmente desbloqueado
Não É Necessária Experiência; Fácil De Seguir
Yamazen Corporation (8051.T) Bundle
Aprimore suas opções de investimento com a calculadora DCF (8051T)! Utilize dados financeiros reais da Yamazen Corporation, ajuste as projeções e despesas de crescimento e observe instantaneamente como essas mudanças afetam o valor intrínseco de (8051T).
Discounted Cash Flow (DCF) - (USD MM)
| Year | AY1 2020 |
AY2 2021 |
AY3 2022 |
AY4 2023 |
AY5 2024 |
FY1 2025 |
FY2 2026 |
FY3 2027 |
FY4 2028 |
FY5 2029 |
|---|---|---|---|---|---|---|---|---|---|---|
| Revenue | 434,744.0 | 501,872.0 | 527,263.0 | 506,866.0 | 516,126.0 | 539,943.3 | 564,859.7 | 590,925.9 | 618,194.9 | 646,722.3 |
| Revenue Growth, % | 0 | 15.44 | 5.06 | -3.87 | 1.83 | 4.61 | 4.61 | 4.61 | 4.61 | 4.61 |
| EBITDA | 15,122.0 | 20,152.0 | 20,908.0 | 14,968.0 | 17,274.0 | 19,177.7 | 20,062.7 | 20,988.5 | 21,957.1 | 22,970.3 |
| EBITDA, % | 3.48 | 4.02 | 3.97 | 2.95 | 3.35 | 3.55 | 3.55 | 3.55 | 3.55 | 3.55 |
| Depreciation | 2,054.0 | 2,028.0 | 3,317.0 | 4,360.0 | 4,808.0 | 3,560.8 | 3,725.1 | 3,897.0 | 4,076.9 | 4,265.0 |
| Depreciation, % | 0.47246 | 0.40409 | 0.6291 | 0.86019 | 0.93156 | 0.65948 | 0.65948 | 0.65948 | 0.65948 | 0.65948 |
| EBIT | 13,068.0 | 18,124.0 | 17,591.0 | 10,608.0 | 12,466.0 | 15,616.9 | 16,337.6 | 17,091.5 | 17,880.2 | 18,705.3 |
| EBIT, % | 3.01 | 3.61 | 3.34 | 2.09 | 2.42 | 2.89 | 2.89 | 2.89 | 2.89 | 2.89 |
| Total Cash | 75,734.0 | 82,401.0 | 82,142.0 | 89,092.0 | 74,298.0 | 87,892.4 | 91,948.3 | 96,191.4 | 100,630.2 | 105,274.0 |
| Total Cash, percent | .0 | .0 | .0 | .0 | .0 | .0 | .0 | .0 | .0 | .0 |
| Account Receivables | 97,478.0 | 109,183.0 | 105,323.0 | 107,263.0 | 105,831.0 | 114,272.9 | 119,546.2 | 125,062.8 | 130,834.0 | 136,871.5 |
| Account Receivables, % | 22.42 | 21.76 | 19.98 | 21.16 | 20.5 | 21.16 | 21.16 | 21.16 | 21.16 | 21.16 |
| Inventories | 25,425.0 | 36,819.0 | 45,224.0 | 39,627.0 | 42,083.0 | 40,747.8 | 42,628.1 | 44,595.3 | 46,653.2 | 48,806.1 |
| Inventories, % | 5.85 | 7.34 | 8.58 | 7.82 | 8.15 | 7.55 | 7.55 | 7.55 | 7.55 | 7.55 |
| Accounts Payable | 112,145.0 | 125,889.0 | 123,596.0 | 62,266.0 | 119,774.0 | 118,583.9 | 124,056.1 | 129,780.8 | 135,769.7 | 142,035.0 |
| Accounts Payable, % | 25.8 | 25.08 | 23.44 | 12.28 | 23.21 | 21.96 | 21.96 | 21.96 | 21.96 | 21.96 |
| Capital Expenditure | -4,599.0 | -4,178.0 | -3,352.0 | -2,407.0 | -5,237.0 | -4,336.4 | -4,536.5 | -4,745.9 | -4,964.9 | -5,194.0 |
| Capital Expenditure, % | -1.06 | -0.83248 | -0.63574 | -0.47488 | -1.01 | -0.80313 | -0.80313 | -0.80313 | -0.80313 | -0.80313 |
| Tax Rate, % | 35.99 | 35.99 | 35.99 | 35.99 | 35.99 | 35.99 | 35.99 | 35.99 | 35.99 | 35.99 |
| EBITAT | 8,761.4 | 12,209.6 | 12,712.7 | 6,631.8 | 7,979.4 | 10,407.3 | 10,887.6 | 11,390.0 | 11,915.6 | 12,465.5 |
| Depreciation | ||||||||||
| Changes in Account Receivables | ||||||||||
| Changes in Inventories | ||||||||||
| Changes in Accounts Payable | ||||||||||
| Capital Expenditure | ||||||||||
| UFCF | -4,541.6 | 704.6 | 5,839.7 | -49,088.2 | 64,034.4 | 1,334.9 | 8,394.7 | 8,782.1 | 9,187.4 | 9,611.3 |
| WACC, % | 5.63 | 5.63 | 5.65 | 5.62 | 5.62 | 5.63 | 5.63 | 5.63 | 5.63 | 5.63 |
| PV UFCF | ||||||||||
| SUM PV UFCF | 30,925.9 | |||||||||
| Long Term Growth Rate, % | 0.50 | |||||||||
| Free cash flow (T + 1) | 9,659 | |||||||||
| Terminal Value | 188,238 | |||||||||
| Present Terminal Value | 143,133 | |||||||||
| Enterprise Value | 174,059 | |||||||||
| Net Debt | -51,198 | |||||||||
| Equity Value | 225,257 | |||||||||
| Diluted Shares Outstanding, MM | 95 | |||||||||
| Equity Value Per Share | 2,376.78 |
Benefits You Will Receive
- Customizable Excel Template: An adaptable Excel-based DCF Calculator featuring pre-filled real financial data for Yamazen Corporation (8051T).
- Authentic Data: Historical performance metrics and forward-looking projections (highlighted in the yellow cells).
- Adjustable Forecasts: Modify assumptions for revenue growth, EBITDA margin, and WACC.
- Instant Calculations: Quickly assess how your inputs influence the valuation of Yamazen Corporation (8051T).
- Professional Resource: Designed for investors, CFOs, consultants, and financial analysts.
- User-Friendly Interface: Organized for clarity and ease of navigation, complete with step-by-step guidance.
Key Features of Yamazen Corporation (8051T)
- Customizable Financial Inputs: Adjust essential parameters such as revenue growth rates, EBITDA percentages, and capital expenditures.
- Instant DCF Valuation: Automatically computes intrinsic value, NPV, and various financial metrics in real-time.
- High-Precision Accuracy: Leverages Yamazen’s actual financial data for realistic and reliable valuation results.
- Streamlined Scenario Analysis: Effortlessly explore different assumptions and analyze the resulting impacts.
- Efficiency Booster: Save time by avoiding the need to construct intricate valuation models from the ground up.
How It Works
- 1. Access the Template: Download and open the Excel file containing Yamazen Corporation's (8051T) preloaded data.
- 2. Adjust Assumptions: Modify key inputs such as growth rates, WACC, and capital expenditures to fit your analysis.
- 3. Get Instant Results: The DCF model automatically calculates the intrinsic value and NPV based on your inputs.
- 4. Explore Scenarios: Evaluate different forecasts to assess various valuation possibilities.
- 5. Present with Assurance: Deliver professional valuation insights that enhance your decision-making process.
Why Opt for Yamazen's Calculator?
- Save Time: Skip the hassle of building a DCF model from the ground up – our calculator is ready for immediate use.
- Enhance Accuracy: Dependable financial data and formulas help minimize errors in your valuation process.
- Completely Customizable: Adjust the model to align with your specific assumptions and forecasts.
- User-Friendly Visualization: Intuitive charts and outputs ensure that the results are easy to interpret and analyze.
- Reliably Used by Professionals: Crafted for experts who prioritize both precision and usability.
Who Should Use This Product?
- Investors: Evaluate Yamazen Corporation’s (8051T) valuation prior to making stock transactions.
- CFOs and Financial Analysts: Optimize valuation methodologies and assess financial projections for Yamazen Corporation.
- Startup Founders: Gain insights into how large public entities like Yamazen Corporation are valued.
- Consultants: Create detailed valuation reports for your clients concerning Yamazen Corporation.
- Students and Educators: Utilize real-time data to enhance your understanding of valuation practices with Yamazen Corporation.
Overview of Template Components
- Historical Data: Compiles Yamazen Corporation’s (8051T) previous financial performance and foundational forecasts.
- DCF and Levered DCF Models: Comprehensive templates designed to assess Yamazen Corporation’s intrinsic value.
- WACC Sheet: Pre-constructed calculations for Weighted Average Cost of Capital.
- Editable Inputs: Customize essential parameters such as growth rates, EBITDA %, and CAPEX estimates.
- Quarterly and Annual Statements: A thorough analysis of Yamazen Corporation’s financial reports.
- Interactive Dashboard: Dynamic visualization of valuation outcomes and forecasts.
Disclaimer
All information, articles, and product details provided on this website are for general informational and educational purposes only. We do not claim any ownership over, nor do we intend to infringe upon, any trademarks, copyrights, logos, brand names, or other intellectual property mentioned or depicted on this site. Such intellectual property remains the property of its respective owners, and any references here are made solely for identification or informational purposes, without implying any affiliation, endorsement, or partnership.
We make no representations or warranties, express or implied, regarding the accuracy, completeness, or suitability of any content or products presented. Nothing on this website should be construed as legal, tax, investment, financial, medical, or other professional advice. In addition, no part of this site—including articles or product references—constitutes a solicitation, recommendation, endorsement, advertisement, or offer to buy or sell any securities, franchises, or other financial instruments, particularly in jurisdictions where such activity would be unlawful.
All content is of a general nature and may not address the specific circumstances of any individual or entity. It is not a substitute for professional advice or services. Any actions you take based on the information provided here are strictly at your own risk. You accept full responsibility for any decisions or outcomes arising from your use of this website and agree to release us from any liability in connection with your use of, or reliance upon, the content or products found herein.