
|
Nipro Corporation (8086.T) Avaliação DCF |
Totalmente Editável: Adapte-Se Às Suas Necessidades No Excel Ou Planilhas
Design Profissional: Modelos Confiáveis E Padrão Da Indústria
Pré-Construídos Para Uso Rápido E Eficiente
Compatível com MAC/PC, totalmente desbloqueado
Não É Necessária Experiência; Fácil De Seguir
Nipro Corporation (8086.T) Bundle
Avalie as perspectivas financeiras da Nipro Corporation com precisão especializada! Esta calculadora (8086T) DCF fornece finanças pré-preenchidas e oferece total flexibilidade para modificar o crescimento da receita, WACC, margens e outras suposições cruciais adaptadas às suas projeções.
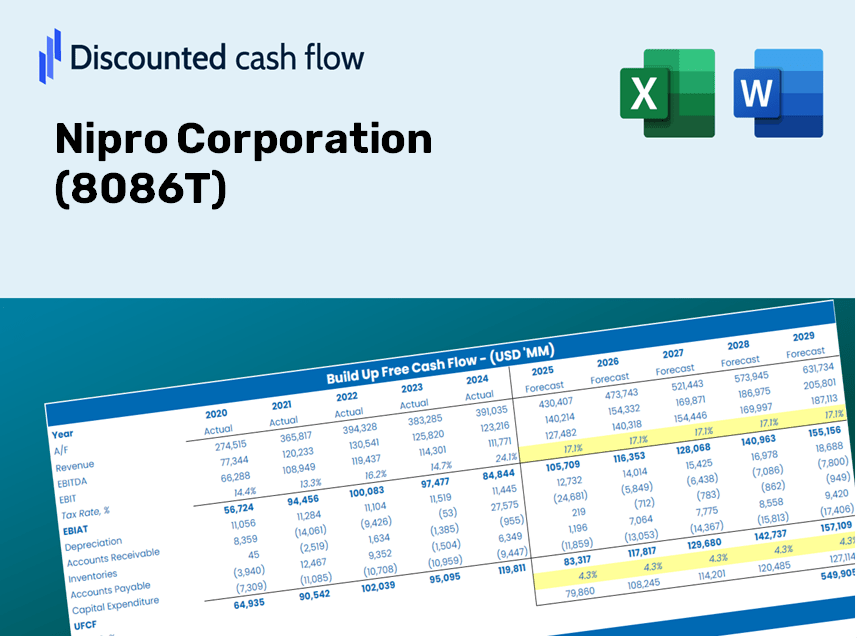
Discounted Cash Flow (DCF) - (USD MM)
| Year | AY1 2020 |
AY2 2021 |
AY3 2022 |
AY4 2023 |
AY5 2024 |
FY1 2025 |
FY2 2026 |
FY3 2027 |
FY4 2028 |
FY5 2029 |
|---|---|---|---|---|---|---|---|---|---|---|
| Revenue | 455,559.0 | 494,789.0 | 545,199.0 | 586,785.0 | 644,586.0 | 703,046.3 | 766,808.5 | 836,353.7 | 912,206.2 | 994,938.0 |
| Revenue Growth, % | 0 | 8.61 | 10.19 | 7.63 | 9.85 | 9.07 | 9.07 | 9.07 | 9.07 | 9.07 |
| EBITDA | 64,877.0 | 73,542.0 | 70,021.0 | 84,619.0 | 92,580.0 | 99,454.6 | 108,474.5 | 118,312.6 | 129,042.8 | 140,746.3 |
| EBITDA, % | 14.24 | 14.86 | 12.84 | 14.42 | 14.36 | 14.15 | 14.15 | 14.15 | 14.15 | 14.15 |
| Depreciation | 42,626.0 | 46,164.0 | 48,743.0 | 58,872.0 | 65,648.0 | 67,274.2 | 73,375.6 | 80,030.3 | 87,288.6 | 95,205.2 |
| Depreciation, % | 9.36 | 9.33 | 8.94 | 10.03 | 10.18 | 9.57 | 9.57 | 9.57 | 9.57 | 9.57 |
| EBIT | 22,251.0 | 27,378.0 | 21,278.0 | 25,747.0 | 26,932.0 | 32,180.4 | 35,099.0 | 38,282.2 | 41,754.2 | 45,541.1 |
| EBIT, % | 4.88 | 5.53 | 3.9 | 4.39 | 4.18 | 4.58 | 4.58 | 4.58 | 4.58 | 4.58 |
| Total Cash | 90,274.0 | 95,342.0 | 89,678.0 | 99,667.0 | 106,668.0 | 125,237.2 | 136,595.5 | 148,984.0 | 162,495.9 | 177,233.4 |
| Total Cash, percent | .0 | .0 | .0 | .0 | .0 | .0 | .0 | .0 | .0 | .0 |
| Account Receivables | 139,339.0 | 138,464.0 | 156,114.0 | 154,878.0 | 160,320.0 | 194,703.4 | 212,361.9 | 231,621.9 | 252,628.7 | 275,540.6 |
| Account Receivables, % | 30.59 | 27.98 | 28.63 | 26.39 | 24.87 | 27.69 | 27.69 | 27.69 | 27.69 | 27.69 |
| Inventories | 164,219.0 | 176,144.0 | 207,793.0 | 227,063.0 | 251,111.0 | 263,521.3 | 287,421.2 | 313,488.6 | 341,920.3 | 372,930.5 |
| Inventories, % | 36.05 | 35.6 | 38.11 | 38.7 | 38.96 | 37.48 | 37.48 | 37.48 | 37.48 | 37.48 |
| Accounts Payable | 67,219.0 | 73,544.0 | 76,141.0 | 81,502.0 | 83,802.0 | 99,094.7 | 108,082.0 | 117,884.4 | 128,575.8 | 140,236.9 |
| Accounts Payable, % | 14.76 | 14.86 | 13.97 | 13.89 | 13 | 14.1 | 14.1 | 14.1 | 14.1 | 14.1 |
| Capital Expenditure | -51,182.0 | -79,803.0 | -84,835.0 | -94,203.0 | -76,608.0 | -99,639.9 | -108,676.7 | -118,533.0 | -129,283.3 | -141,008.6 |
| Capital Expenditure, % | -11.23 | -16.13 | -15.56 | -16.05 | -11.88 | -14.17 | -14.17 | -14.17 | -14.17 | -14.17 |
| Tax Rate, % | 73.21 | 73.21 | 73.21 | 73.21 | 73.21 | 73.21 | 73.21 | 73.21 | 73.21 | 73.21 |
| EBITAT | 18,046.9 | 15,848.7 | 5,801.1 | 14,882.3 | 7,215.9 | 16,145.1 | 17,609.4 | 19,206.5 | 20,948.4 | 22,848.3 |
| Depreciation | ||||||||||
| Changes in Account Receivables | ||||||||||
| Changes in Inventories | ||||||||||
| Changes in Accounts Payable | ||||||||||
| Capital Expenditure | ||||||||||
| UFCF | -226,848.1 | -22,515.3 | -76,992.9 | -33,121.7 | -30,934.1 | -47,721.6 | -50,262.7 | -54,821.3 | -59,793.3 | -65,216.2 |
| WACC, % | 3.7 | 3.12 | 2.35 | 3.12 | 2.34 | 2.93 | 2.93 | 2.93 | 2.93 | 2.93 |
| PV UFCF | ||||||||||
| SUM PV UFCF | -253,825.0 | |||||||||
| Long Term Growth Rate, % | 2.00 | |||||||||
| Free cash flow (T + 1) | -66,520 | |||||||||
| Terminal Value | -7,183,441 | |||||||||
| Present Terminal Value | -6,218,799 | |||||||||
| Enterprise Value | -6,472,624 | |||||||||
| Net Debt | 530,412 | |||||||||
| Equity Value | -7,003,036 | |||||||||
| Diluted Shares Outstanding, MM | 184 | |||||||||
| Equity Value Per Share | -38,049.02 |
Benefits You Will Receive
- Comprehensive Financial Model: Leverage Nipro Corporation’s (8086T) real data for accurate DCF valuation.
- Complete Forecast Flexibility: Modify revenue growth, profit margins, WACC, and other essential factors.
- Real-Time Calculations: Get immediate updates to see the impact of your adjustments.
- Professional-Grade Template: An optimized Excel file ready for investment presentations.
- Adaptable and Reusable: Designed for versatility, enabling consistent use for in-depth forecasts.
Key Features
- Comprehensive Nipro Data: Pre-loaded with Nipro Corporation's historical financial performance and future projections.
- Customizable Input Parameters: Modify revenue growth rates, profit margins, WACC, tax rates, and capital expenditures as needed.
- Interactive Valuation Framework: Automatically updates Net Present Value (NPV) and intrinsic value based on your customized inputs.
- Scenario Analysis: Develop various forecasting scenarios to explore different valuation results.
- Intuitive User Interface: Designed for ease of use, catering to both professionals and novices.
How It Operates
- Download the Template: Gain immediate access to the Excel-based Nipro Corporation (8086T) DCF Calculator.
- Input Your Assumptions: Modify the yellow-highlighted cells for growth rates, WACC, margins, and other variables.
- Instant Calculations: The model automatically recalculates Nipro's intrinsic value.
- Test Scenarios: Experiment with different assumptions to assess changes in valuation.
- Analyze and Decide: Utilize the findings to inform your investment or financial assessments.
Why Select This Calculator for Nipro Corporation (8086T)?
- Designed for Experts: A sophisticated tool utilized by analysts, CFOs, and consultants.
- Accurate Financial Data: Nipro's historical and projected financial information is preloaded to ensure precision.
- Flexible Scenario Analysis: Easily test various forecasts and assumptions.
- Clear Results: Automatically computes intrinsic value, NPV, and essential metrics.
- User-Friendly: Comprehensive step-by-step instructions help you navigate the tool effortlessly.
Who Can Benefit from This Product?
- Investors: Assess Nipro Corporation's (8086T) valuation before making trading decisions.
- CFOs and Financial Analysts: Enhance valuation workflows and evaluate financial forecasts.
- Startup Founders: Understand how prominent public companies like Nipro Corporation (8086T) are appraised.
- Consultants: Provide clients with comprehensive valuation reports based on Nipro Corporation (8086T).
- Students and Educators: Utilize real-world data for practicing and instructing valuation methods.
Contents of the Template
- Pre-Filled Data: Features Nipro Corporation's historical financial data and projections.
- Discounted Cash Flow Model: Editable DCF valuation model with automatic computations.
- Weighted Average Cost of Capital (WACC): A specific worksheet for calculating WACC using customized inputs.
- Key Financial Ratios: Evaluate Nipro Corporation's profitability, efficiency, and financial leverage.
- Customizable Inputs: Easily modify revenue growth, profit margins, and tax rates.
- User-Friendly Dashboard: Visualizations and tables summarizing essential valuation outcomes.
Disclaimer
All information, articles, and product details provided on this website are for general informational and educational purposes only. We do not claim any ownership over, nor do we intend to infringe upon, any trademarks, copyrights, logos, brand names, or other intellectual property mentioned or depicted on this site. Such intellectual property remains the property of its respective owners, and any references here are made solely for identification or informational purposes, without implying any affiliation, endorsement, or partnership.
We make no representations or warranties, express or implied, regarding the accuracy, completeness, or suitability of any content or products presented. Nothing on this website should be construed as legal, tax, investment, financial, medical, or other professional advice. In addition, no part of this site—including articles or product references—constitutes a solicitation, recommendation, endorsement, advertisement, or offer to buy or sell any securities, franchises, or other financial instruments, particularly in jurisdictions where such activity would be unlawful.
All content is of a general nature and may not address the specific circumstances of any individual or entity. It is not a substitute for professional advice or services. Any actions you take based on the information provided here are strictly at your own risk. You accept full responsibility for any decisions or outcomes arising from your use of this website and agree to release us from any liability in connection with your use of, or reliance upon, the content or products found herein.