
|
Izumi Co., Ltd. (8273.T) Avaliação DCF |
Totalmente Editável: Adapte-Se Às Suas Necessidades No Excel Ou Planilhas
Design Profissional: Modelos Confiáveis E Padrão Da Indústria
Pré-Construídos Para Uso Rápido E Eficiente
Compatível com MAC/PC, totalmente desbloqueado
Não É Necessária Experiência; Fácil De Seguir
Izumi Co., Ltd. (8273.T) Bundle
Seja você um investidor ou analista, esta calculadora DCF (8273T) é o seu recurso preferido para uma avaliação precisa. Apresentando dados reais da Izumi Co., Ltd., você pode ajustar facilmente as previsões e observar os resultados em tempo real.
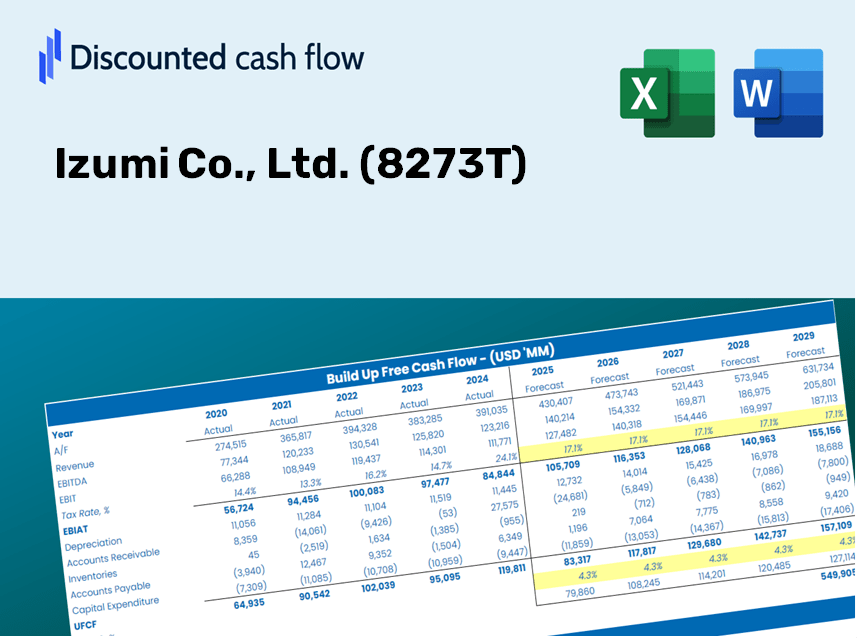
Discounted Cash Flow (DCF) - (USD MM)
| Year | AY1 2020 |
AY2 2021 |
AY3 2022 |
AY4 2023 |
AY5 2024 |
FY1 2025 |
FY2 2026 |
FY3 2027 |
FY4 2028 |
FY5 2029 |
|---|---|---|---|---|---|---|---|---|---|---|
| Revenue | 679,777.0 | 676,799.0 | 460,139.0 | 471,165.0 | 524,142.0 | 499,493.6 | 476,004.3 | 453,619.6 | 432,287.6 | 411,958.8 |
| Revenue Growth, % | 0 | -0.43808 | -32.01 | 2.4 | 11.24 | -4.7 | -4.7 | -4.7 | -4.7 | -4.7 |
| EBITDA | 52,391.0 | 51,387.0 | 51,223.0 | 46,973.0 | 41,460.0 | 44,266.5 | 42,184.9 | 40,201.1 | 38,310.6 | 36,509.0 |
| EBITDA, % | 7.71 | 7.59 | 11.13 | 9.97 | 7.91 | 8.86 | 8.86 | 8.86 | 8.86 | 8.86 |
| Depreciation | 16,609.0 | 16,670.0 | 16,529.0 | 17,173.0 | 20,343.0 | 16,008.3 | 15,255.5 | 14,538.1 | 13,854.4 | 13,202.9 |
| Depreciation, % | 2.44 | 2.46 | 3.59 | 3.64 | 3.88 | 3.2 | 3.2 | 3.2 | 3.2 | 3.2 |
| EBIT | 35,782.0 | 34,717.0 | 34,694.0 | 29,800.0 | 21,117.0 | 28,258.2 | 26,929.4 | 25,663.0 | 24,456.1 | 23,306.1 |
| EBIT, % | 5.26 | 5.13 | 7.54 | 6.32 | 4.03 | 5.66 | 5.66 | 5.66 | 5.66 | 5.66 |
| Total Cash | 25,306.0 | 11,621.0 | 10,331.0 | 11,997.0 | 15,717.0 | 13,216.4 | 12,594.9 | 12,002.6 | 11,438.2 | 10,900.3 |
| Total Cash, percent | .0 | .0 | .0 | .0 | .0 | .0 | .0 | .0 | .0 | .0 |
| Account Receivables | 41,947.0 | 42,283.0 | 46,971.0 | 51,471.0 | 58,673.0 | 44,699.2 | 42,597.2 | 40,594.0 | 38,685.0 | 36,865.8 |
| Account Receivables, % | 6.17 | 6.25 | 10.21 | 10.92 | 11.19 | 8.95 | 8.95 | 8.95 | 8.95 | 8.95 |
| Inventories | 22,139.0 | 21,157.0 | 24,387.0 | 26,260.0 | 30,074.0 | 22,970.7 | 21,890.4 | 20,861.0 | 19,880.0 | 18,945.1 |
| Inventories, % | 3.26 | 3.13 | 5.3 | 5.57 | 5.74 | 4.6 | 4.6 | 4.6 | 4.6 | 4.6 |
| Accounts Payable | 47,367.0 | 29,697.0 | 26,076.0 | 24,140.0 | 29,024.0 | 27,655.7 | 26,355.2 | 25,115.8 | 23,934.7 | 22,809.1 |
| Accounts Payable, % | 6.97 | 4.39 | 5.67 | 5.12 | 5.54 | 5.54 | 5.54 | 5.54 | 5.54 | 5.54 |
| Capital Expenditure | -13,921.0 | -16,335.0 | -12,147.0 | -28,440.0 | -17,745.0 | -16,506.2 | -15,730.0 | -14,990.3 | -14,285.3 | -13,613.5 |
| Capital Expenditure, % | -2.05 | -2.41 | -2.64 | -6.04 | -3.39 | -3.3 | -3.3 | -3.3 | -3.3 | -3.3 |
| Tax Rate, % | 41.86 | 41.86 | 41.86 | 41.86 | 41.86 | 41.86 | 41.86 | 41.86 | 41.86 | 41.86 |
| EBITAT | 23,668.2 | 23,499.8 | 23,478.3 | 20,701.7 | 12,278.3 | 18,600.7 | 17,726.0 | 16,892.4 | 16,098.1 | 15,341.0 |
| Depreciation | ||||||||||
| Changes in Account Receivables | ||||||||||
| Changes in Inventories | ||||||||||
| Changes in Accounts Payable | ||||||||||
| Capital Expenditure | ||||||||||
| UFCF | 9,637.2 | 6,810.8 | 16,321.3 | 1,125.7 | 8,744.3 | 37,811.7 | 19,133.3 | 18,233.5 | 17,376.0 | 16,558.9 |
| WACC, % | 3.68 | 3.7 | 3.7 | 3.72 | 3.56 | 3.67 | 3.67 | 3.67 | 3.67 | 3.67 |
| PV UFCF | ||||||||||
| SUM PV UFCF | 99,507.6 | |||||||||
| Long Term Growth Rate, % | 0.50 | |||||||||
| Free cash flow (T + 1) | 16,642 | |||||||||
| Terminal Value | 524,683 | |||||||||
| Present Terminal Value | 438,121 | |||||||||
| Enterprise Value | 537,629 | |||||||||
| Net Debt | 123,737 | |||||||||
| Equity Value | 413,892 | |||||||||
| Diluted Shares Outstanding, MM | 72 | |||||||||
| Equity Value Per Share | 5,785.22 |
What You Will Receive
- Authentic Izumi Data: Preloaded financials – covering everything from revenue to EBIT – based on verified and projected metrics.
- Complete Customization: Modify all key parameters (highlighted cells) such as WACC, growth %, and tax rates.
- Instant Valuation Refresh: Automatic recalculations to examine the effects of changes on Izumi Co., Ltd.'s fair value.
- Flexible Excel Template: Designed for easy edits, scenario analysis, and comprehensive forecasts.
- Efficient and Precise: Avoid the hassle of constructing models from the ground up while ensuring accuracy and adaptability.
Key Features
- Comprehensive DCF Calculator: Features in-depth unlevered and levered DCF valuation models tailored for Izumi Co., Ltd. (8273T).
- WACC Calculator: Ready-to-use Weighted Average Cost of Capital sheet with adjustable inputs for precision.
- Customizable Forecast Assumptions: Easily adjust growth rates, capital expenditures, and discount rates.
- Integrated Financial Ratios: Evaluate profitability, leverage, and efficiency ratios relevant to Izumi Co., Ltd. (8273T).
- Interactive Dashboard and Charts: Visual representations that present key valuation metrics for straightforward analysis.
How It Functions
- 1. Access the Template: Download and open the Excel file containing Izumi Co., Ltd.'s (8273T) preloaded data.
- 2. Modify Assumptions: Adjust key variables such as growth rates, WACC, and capital expenditures.
- 3. Instant Result Visualization: The DCF model automatically computes intrinsic value and NPV.
- 4. Scenario Testing: Evaluate various forecasts to explore different valuation outcomes.
- 5. Present with Assurance: Deliver professional valuation insights to guide your decision-making process.
Why Opt for the Izumi Co., Ltd. Calculator?
- Precision: Utilize real financial data from Izumi Co., Ltd. for unmatched accuracy.
- Versatility: Tailored for users to easily experiment and adjust inputs.
- Efficiency: Eliminate the complexity of constructing a DCF model from the ground up.
- High-Quality: Crafted with the meticulousness expected at the CFO level.
- Accessible: Intuitive interface designed for users of all experience levels in financial modeling.
Who Can Benefit from Izumi Co., Ltd. (8273T)?
- Investors: Evaluate Izumi Co., Ltd. (8273T) for informed stock trading decisions.
- CFOs and Financial Analysts: Optimize valuation methodologies and assess financial forecasts.
- Startup Founders: Gain insights into the valuation practices of established companies like Izumi Co., Ltd. (8273T).
- Consultants: Provide clients with expert valuation reports tailored to Izumi Co., Ltd. (8273T).
- Students and Educators: Utilize current data to enhance learning and teaching of valuation strategies.
Contents of the Template
- Preloaded Izumi Co., Ltd. (8273T) Data: Historical and projected financial metrics, including revenue, EBIT, and capital expenditures.
- DCF and WACC Models: High-quality spreadsheets designed for calculating intrinsic value and Weighted Average Cost of Capital.
- Editable Inputs: Cells highlighted in yellow for modifying revenue growth, tax rates, and discount rates.
- Financial Statements: Detailed annual and quarterly reports for in-depth analysis.
- Key Ratios: Indicators of profitability, leverage, and efficiency to assess performance.
- Dashboard and Charts: Visual representations of valuation results and underlying assumptions.
Disclaimer
All information, articles, and product details provided on this website are for general informational and educational purposes only. We do not claim any ownership over, nor do we intend to infringe upon, any trademarks, copyrights, logos, brand names, or other intellectual property mentioned or depicted on this site. Such intellectual property remains the property of its respective owners, and any references here are made solely for identification or informational purposes, without implying any affiliation, endorsement, or partnership.
We make no representations or warranties, express or implied, regarding the accuracy, completeness, or suitability of any content or products presented. Nothing on this website should be construed as legal, tax, investment, financial, medical, or other professional advice. In addition, no part of this site—including articles or product references—constitutes a solicitation, recommendation, endorsement, advertisement, or offer to buy or sell any securities, franchises, or other financial instruments, particularly in jurisdictions where such activity would be unlawful.
All content is of a general nature and may not address the specific circumstances of any individual or entity. It is not a substitute for professional advice or services. Any actions you take based on the information provided here are strictly at your own risk. You accept full responsibility for any decisions or outcomes arising from your use of this website and agree to release us from any liability in connection with your use of, or reliance upon, the content or products found herein.