
|
SURUGA BANK LTD. (8358.T) Avaliação DCF |
Totalmente Editável: Adapte-Se Às Suas Necessidades No Excel Ou Planilhas
Design Profissional: Modelos Confiáveis E Padrão Da Indústria
Pré-Construídos Para Uso Rápido E Eficiente
Compatível com MAC/PC, totalmente desbloqueado
Não É Necessária Experiência; Fácil De Seguir
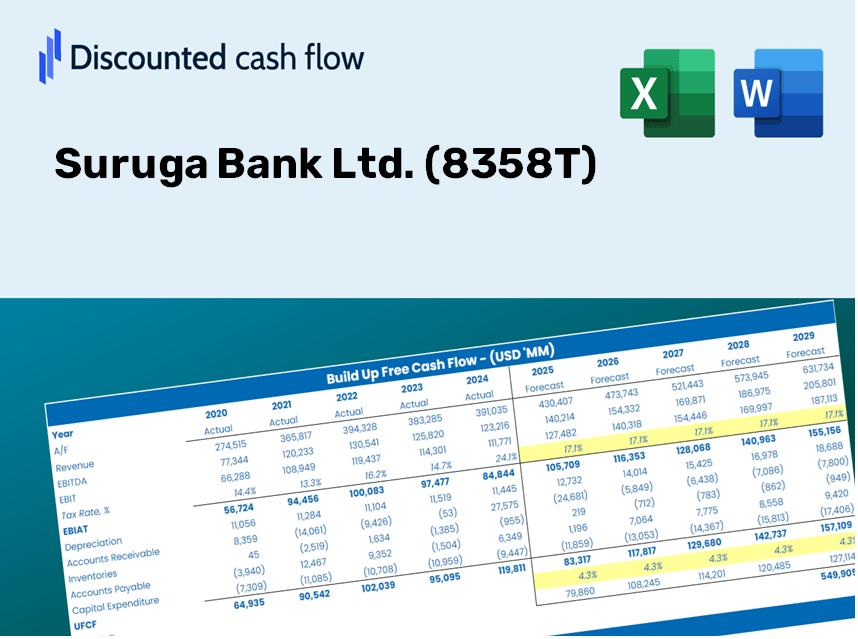
Suruga Bank Ltd. (8358.T) Bundle
Projetado para precisão, nossa calculadora DCF (8358T) permite avaliar a avaliação da Suruga Bank Ltd. usando dados financeiros do mundo real, fornecendo flexibilidade completa para modificar todos os parâmetros essenciais para projeções aprimoradas.
Discounted Cash Flow (DCF) - (USD MM)
| Year | AY1 2021 |
AY2 2022 |
AY3 2023 |
AY4 2024 |
AY5 2025 |
FY1 2026 |
FY2 2027 |
FY3 2028 |
FY4 2029 |
FY5 2030 |
|---|---|---|---|---|---|---|---|---|---|---|
| Revenue | 85,217.0 | 69,699.0 | 57,187.0 | 73,156.0 | 69,234.0 | 66,880.3 | 64,606.6 | 62,410.3 | 60,288.6 | 58,239.0 |
| Revenue Growth, % | 0 | -18.21 | -17.95 | 27.92 | -5.36 | -3.4 | -3.4 | -3.4 | -3.4 | -3.4 |
| EBITDA | 28,425.0 | 14,829.0 | 17,599.0 | .0 | 30,799.0 | 17,374.4 | 16,783.7 | 16,213.1 | 15,662.0 | 15,129.5 |
| EBITDA, % | 33.36 | 21.28 | 30.77 | 0 | 44.49 | 25.98 | 25.98 | 25.98 | 25.98 | 25.98 |
| Depreciation | 5,653.0 | 5,767.0 | 5,563.0 | 5,322.0 | 6,082.0 | 5,443.4 | 5,258.3 | 5,079.6 | 4,906.9 | 4,740.1 |
| Depreciation, % | 6.63 | 8.27 | 9.73 | 7.27 | 8.78 | 8.14 | 8.14 | 8.14 | 8.14 | 8.14 |
| EBIT | 22,772.0 | 9,062.0 | 12,036.0 | -5,322.0 | 24,717.0 | 11,931.0 | 11,525.4 | 11,133.6 | 10,755.1 | 10,389.4 |
| EBIT, % | 26.72 | 13 | 21.05 | -7.27 | 35.7 | 17.84 | 17.84 | 17.84 | 17.84 | 17.84 |
| Total Cash | 953,932.0 | 874,184.0 | 1,044,263.0 | 982,204.0 | 693,361.0 | 66,880.3 | 64,606.6 | 62,410.3 | 60,288.6 | 58,239.0 |
| Total Cash, percent | .0 | .0 | .0 | .0 | .0 | .0 | .0 | .0 | .0 | .0 |
| Account Receivables | .0 | .0 | .0 | .0 | .0 | .0 | .0 | .0 | .0 | .0 |
| Account Receivables, % | 0 | 0 | 0 | 0 | 0 | 0 | 0 | 0 | 0 | 0 |
| Inventories | .0 | .0 | .0 | .0 | .0 | .0 | .0 | .0 | .0 | .0 |
| Inventories, % | 0 | 0 | 0 | 0 | 0 | 0 | 0 | 0 | 0 | 0 |
| Accounts Payable | .0 | .0 | .0 | .0 | .0 | .0 | .0 | .0 | .0 | .0 |
| Accounts Payable, % | 0 | 0 | 0 | 0 | 0 | 0 | 0 | 0 | 0 | 0 |
| Capital Expenditure | -4,631.0 | -5,161.0 | -2,319.0 | -2,246.0 | -2,045.0 | -3,065.5 | -2,961.3 | -2,860.6 | -2,763.4 | -2,669.5 |
| Capital Expenditure, % | -5.43 | -7.4 | -4.06 | -3.07 | -2.95 | -4.58 | -4.58 | -4.58 | -4.58 | -4.58 |
| Tax Rate, % | 18.37 | 18.37 | 18.37 | 18.37 | 18.37 | 18.37 | 18.37 | 18.37 | 18.37 | 18.37 |
| EBITAT | 21,433.0 | 7,960.9 | 10,576.0 | -4,200.5 | 20,177.0 | 10,270.1 | 9,921.0 | 9,583.7 | 9,257.9 | 8,943.2 |
| Depreciation | ||||||||||
| Changes in Account Receivables | ||||||||||
| Changes in Inventories | ||||||||||
| Changes in Accounts Payable | ||||||||||
| Capital Expenditure | ||||||||||
| UFCF | 22,455.0 | 8,566.9 | 13,820.0 | -1,124.5 | 24,214.0 | 12,648.0 | 12,218.0 | 11,802.7 | 11,401.4 | 11,013.8 |
| WACC, % | 6.18 | 6.12 | 6.12 | 6.05 | 6.07 | 6.11 | 6.11 | 6.11 | 6.11 | 6.11 |
| PV UFCF | ||||||||||
| SUM PV UFCF | 49,833.4 | |||||||||
| Long Term Growth Rate, % | 2.00 | |||||||||
| Free cash flow (T + 1) | 11,234 | |||||||||
| Terminal Value | 273,440 | |||||||||
| Present Terminal Value | 203,288 | |||||||||
| Enterprise Value | 253,122 | |||||||||
| Net Debt | -693,361 | |||||||||
| Equity Value | 946,483 | |||||||||
| Diluted Shares Outstanding, MM | 184 | |||||||||
| Equity Value Per Share | 5,153.08 |
What You Will Receive
- Adjustable Forecast Inputs: Seamlessly modify assumptions (growth %, margins, WACC) to explore various scenarios.
- Comprehensive Data: Suruga Bank Ltd.’s (8358T) financial information pre-loaded to facilitate your analysis.
- Automated DCF Outputs: The template provides you with calculated Net Present Value (NPV) and intrinsic value.
- Professional and Tailorable: A refined Excel model that caters to your valuation requirements.
- Designed for Analysts and Investors: Perfect for evaluating projections, validating strategies, and enhancing efficiency.
Key Features
- 🔍 Real-Life Suruga Bank Financials: Pre-filled historical and projected data for Suruga Bank Ltd. (8358T).
- ✏️ Fully Customizable Inputs: Modify all essential parameters (yellow cells) such as WACC, growth %, and tax rates.
- 📊 Professional DCF Valuation: Integrated formulas calculate Suruga Bank’s intrinsic value using the Discounted Cash Flow method.
- ⚡ Instant Results: View Suruga Bank’s valuation in real-time after making adjustments.
- Scenario Analysis: Evaluate and compare outcomes for different financial assumptions side-by-side.
How It Functions
- Step 1: Download the Excel spreadsheet.
- Step 2: Examine the pre-filled Suruga Bank Ltd. (8358T) data, both historical and forecasted.
- Step 3: Modify the key assumptions (highlighted in yellow) according to your analysis.
- Step 4: Observe the automatic updates for Suruga Bank Ltd.'s (8358T) intrinsic value.
- Step 5: Utilize the results for making investment choices or preparing reports.
Why Opt for the Suruga Bank Ltd. Calculator?
- Time-Efficient: Start with a pre-built DCF model – no need to build one from the ground up.
- Enhanced Accuracy: Dependable financial data and formulas minimize valuation errors.
- Completely Customizable: Adjust the model to align with your unique assumptions and forecasts.
- Simple to Understand: Intuitive charts and outputs facilitate straightforward result analysis.
- Endorsed by Professionals: Crafted for experts who prioritize accuracy and ease of use.
Who Should Utilize This Service?
- Investors: Evaluate Suruga Bank Ltd. (8358T)'s valuation prior to making investment decisions.
- CFOs and Financial Analysts: Optimize valuation methodologies and assess financial forecasts.
- Startup Founders: Discover how major financial institutions like Suruga Bank Ltd. (8358T) are valued.
- Consultants: Provide detailed valuation insights for your clients based on Suruga Bank Ltd. (8358T).
- Students and Educators: Leverage current data from Suruga Bank Ltd. (8358T) to learn and teach valuation strategies.
Overview of the Template Contents
- Historical Data: Contains Suruga Bank Ltd.'s (8358T) previous financial performance and baseline forecasts.
- DCF and Levered DCF Models: Comprehensive templates for calculating the intrinsic value of Suruga Bank Ltd. (8358T).
- WACC Sheet: Pre-calculated metrics for the Weighted Average Cost of Capital.
- Editable Inputs: Adjust essential drivers such as growth rates, EBITDA %, and CAPEX projections.
- Quarterly and Annual Statements: A full analysis of Suruga Bank Ltd.'s (8358T) financials.
- Interactive Dashboard: Dynamically visualize valuation outcomes and future projections.
Disclaimer
All information, articles, and product details provided on this website are for general informational and educational purposes only. We do not claim any ownership over, nor do we intend to infringe upon, any trademarks, copyrights, logos, brand names, or other intellectual property mentioned or depicted on this site. Such intellectual property remains the property of its respective owners, and any references here are made solely for identification or informational purposes, without implying any affiliation, endorsement, or partnership.
We make no representations or warranties, express or implied, regarding the accuracy, completeness, or suitability of any content or products presented. Nothing on this website should be construed as legal, tax, investment, financial, medical, or other professional advice. In addition, no part of this site—including articles or product references—constitutes a solicitation, recommendation, endorsement, advertisement, or offer to buy or sell any securities, franchises, or other financial instruments, particularly in jurisdictions where such activity would be unlawful.
All content is of a general nature and may not address the specific circumstances of any individual or entity. It is not a substitute for professional advice or services. Any actions you take based on the information provided here are strictly at your own risk. You accept full responsibility for any decisions or outcomes arising from your use of this website and agree to release us from any liability in connection with your use of, or reliance upon, the content or products found herein.