
|
Seven Bank, Ltd. (8410.T) Avaliação DCF |
Totalmente Editável: Adapte-Se Às Suas Necessidades No Excel Ou Planilhas
Design Profissional: Modelos Confiáveis E Padrão Da Indústria
Pré-Construídos Para Uso Rápido E Eficiente
Compatível com MAC/PC, totalmente desbloqueado
Não É Necessária Experiência; Fácil De Seguir
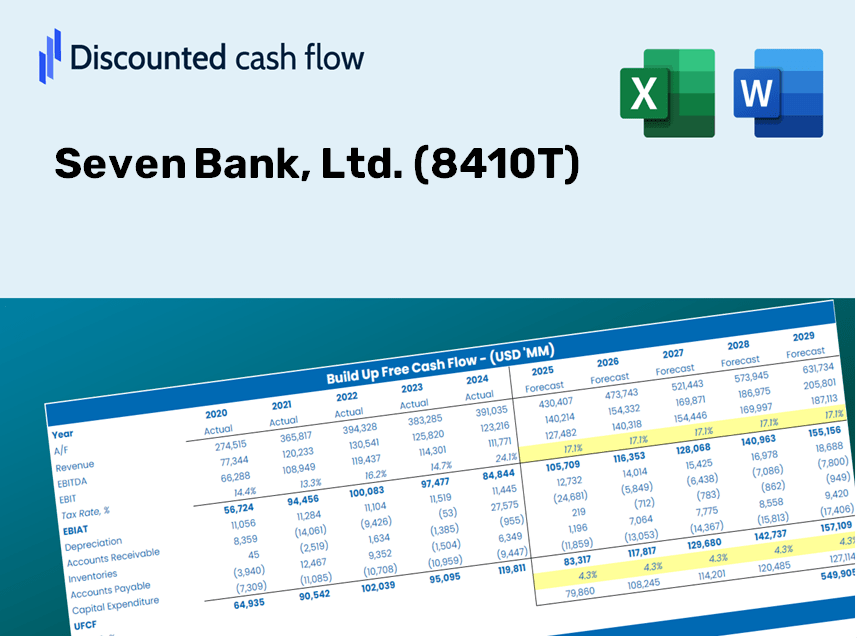
Seven Bank, Ltd. (8410.T) Bundle
Projetado para precisão, nossa calculadora DCF (8410T) permite avaliar a avaliação sete Bank, Ltd. usando dados financeiros reais, oferecendo flexibilidade completa para modificar todos os parâmetros essenciais para melhorar as projeções.
Discounted Cash Flow (DCF) - (USD MM)
| Year | AY1 2021 |
AY2 2022 |
AY3 2023 |
AY4 2024 |
AY5 2025 |
FY1 2026 |
FY2 2027 |
FY3 2028 |
FY4 2029 |
FY5 2030 |
|---|---|---|---|---|---|---|---|---|---|---|
| Revenue | 136,680.0 | 134,896.0 | 152,906.0 | 192,612.0 | 158,755.0 | 166,865.6 | 175,390.6 | 184,351.1 | 193,769.4 | 203,668.9 |
| Revenue Growth, % | 0 | -1.31 | 13.35 | 25.97 | -17.58 | 5.11 | 5.11 | 5.11 | 5.11 | 5.11 |
| EBITDA | 35,249.0 | 43,542.0 | 46,979.0 | .0 | 58,009.0 | 41,827.1 | 43,964.0 | 46,210.1 | 48,570.9 | 51,052.3 |
| EBITDA, % | 25.79 | 32.28 | 30.72 | 0 | 36.54 | 25.07 | 25.07 | 25.07 | 25.07 | 25.07 |
| Depreciation | .0 | 16,388.0 | 19,526.0 | 23,392.0 | 29,173.0 | 18,501.8 | 19,447.1 | 20,440.6 | 21,484.9 | 22,582.5 |
| Depreciation, % | 0 | 12.15 | 12.77 | 12.14 | 18.38 | 11.09 | 11.09 | 11.09 | 11.09 | 11.09 |
| EBIT | 35,249.0 | 27,154.0 | 27,453.0 | -23,392.0 | 28,836.0 | 23,325.3 | 24,516.9 | 25,769.5 | 27,086.0 | 28,469.8 |
| EBIT, % | 25.79 | 20.13 | 17.95 | -12.14 | 18.16 | 13.98 | 13.98 | 13.98 | 13.98 | 13.98 |
| Total Cash | 937,945.0 | 931,404.0 | 952,027.0 | 988,932.0 | 892,852.0 | 166,865.6 | 175,390.6 | 184,351.1 | 193,769.4 | 203,668.9 |
| Total Cash, percent | .0 | .0 | .0 | .0 | .0 | .0 | .0 | .0 | .0 | .0 |
| Account Receivables | .0 | .0 | .0 | 134,340.0 | 128,458.0 | 50,280.7 | 52,849.5 | 55,549.5 | 58,387.5 | 61,370.4 |
| Account Receivables, % | 0 | 0 | 0 | 69.75 | 80.92 | 30.13 | 30.13 | 30.13 | 30.13 | 30.13 |
| Inventories | .0 | .0 | .0 | .0 | .0 | .0 | .0 | .0 | .0 | .0 |
| Inventories, % | 0 | 0 | 0 | 0 | 0 | 0 | 0 | 0 | 0 | 0 |
| Accounts Payable | .0 | .0 | .0 | 42,429.0 | 40,738.0 | 15,915.4 | 16,728.5 | 17,583.1 | 18,481.4 | 19,425.6 |
| Accounts Payable, % | 0 | 0 | 0 | 22.03 | 25.66 | 9.54 | 9.54 | 9.54 | 9.54 | 9.54 |
| Capital Expenditure | -25,244.0 | -24,285.0 | -25,319.0 | -17,739.0 | -45,062.0 | -30,244.4 | -31,789.6 | -33,413.7 | -35,120.7 | -36,915.0 |
| Capital Expenditure, % | -18.47 | -18 | -16.56 | -9.21 | -28.38 | -18.13 | -18.13 | -18.13 | -18.13 | -18.13 |
| Tax Rate, % | 36.81 | 36.81 | 36.81 | 36.81 | 36.81 | 36.81 | 36.81 | 36.81 | 36.81 | 36.81 |
| EBITAT | 25,610.0 | 20,827.0 | 18,874.6 | -16,570.8 | 18,221.0 | 16,427.3 | 17,266.5 | 18,148.7 | 19,075.9 | 20,050.4 |
| Depreciation | ||||||||||
| Changes in Account Receivables | ||||||||||
| Changes in Inventories | ||||||||||
| Changes in Accounts Payable | ||||||||||
| Capital Expenditure | ||||||||||
| UFCF | 366.0 | 12,930.0 | 13,081.6 | -102,828.8 | 6,523.0 | 58,039.3 | 3,168.4 | 3,330.2 | 3,500.4 | 3,679.2 |
| WACC, % | 4.09 | 4.12 | 4.06 | 4.07 | 4.01 | 4.07 | 4.07 | 4.07 | 4.07 | 4.07 |
| PV UFCF | ||||||||||
| SUM PV UFCF | 67,646.9 | |||||||||
| Long Term Growth Rate, % | 2.00 | |||||||||
| Free cash flow (T + 1) | 3,753 | |||||||||
| Terminal Value | 181,248 | |||||||||
| Present Terminal Value | 148,468 | |||||||||
| Enterprise Value | 216,115 | |||||||||
| Net Debt | -794,509 | |||||||||
| Equity Value | 1,010,624 | |||||||||
| Diluted Shares Outstanding, MM | 1,170 | |||||||||
| Equity Value Per Share | 863.83 |
What You Will Gain
- Comprehensive SEVEN Financial Data: Pre-loaded with Seven Bank’s historical and forecasted data for detailed analysis.
- Customizable Template: Easily adjust crucial inputs such as revenue growth, WACC, and EBITDA %.
- Instant Calculations: Observe real-time updates of Seven Bank’s intrinsic value as you modify inputs.
- Expert Valuation Tool: Tailored for investors, analysts, and consultants aiming for reliable DCF outcomes.
- Intuitive Design: Clear layout and straightforward instructions suitable for all skill levels.
Key Features
- Authentic Financial Data for Seven Bank: Access reliable pre-loaded historical information and future predictions.
- Flexible Forecast Parameters: Modify the yellow-highlighted cells for metrics like WACC, growth rates, and profit margins.
- Real-Time Calculations: Automatic adjustments for DCF, Net Present Value (NPV), and cash flow assessments.
- Interactive Dashboard: Clear and concise charts and summaries for effective visualization of your valuation findings.
- Designed for All Users: A user-friendly layout tailored for investors, CFOs, and consultants alike.
How It Works
- Step 1: Download the Excel file for Seven Bank, Ltd. (8410T).
- Step 2: Review the pre-filled financial data and forecasts provided by Seven Bank, Ltd. (8410T).
- Step 3: Adjust key inputs such as revenue growth, WACC, and tax rates (highlighted cells).
- Step 4: Observe the DCF model refresh instantly as you modify your assumptions.
- Step 5: Evaluate the outputs and leverage the results for your investment strategies.
Why Opt for This Calculator?
- Precise Metrics: Authentic Seven Bank financials deliver trustworthy valuation results.
- Fully Customizable: Modify essential parameters such as growth rates, WACC, and tax rates to align with your forecasts.
- Efficient: Ready-made calculations save you the hassle of starting from the ground up.
- Professional-Grade Resource: Tailored for investors, analysts, and consultants alike.
- Easy to Use: User-friendly design and straightforward instructions make it accessible for everyone.
Who Can Benefit from This Product?
- Investors: Assess Seven Bank’s valuation before making stock decisions.
- CFOs and Financial Analysts: Optimize valuation workflows and evaluate financial projections.
- Startup Founders: Discover how prominent banks like Seven Bank are valued.
- Consultants: Create detailed valuation reports for your clients.
- Students and Educators: Utilize real-world examples to enhance learning and practice valuation methods.
Contents of the Template
- Operating and Balance Sheet Data: Pre-filled historical data and forecasts for Seven Bank, Ltd. (8410T), encompassing revenue, EBITDA, EBIT, and capital expenditures.
- WACC Calculation: A specific sheet for calculating the Weighted Average Cost of Capital (WACC), featuring parameters such as Beta, risk-free rate, and share price.
- DCF Valuation (Unlevered and Levered): Customizable Discounted Cash Flow models that display intrinsic value along with comprehensive calculations.
- Financial Statements: Pre-loaded annual and quarterly financial statements to facilitate in-depth analysis.
- Key Ratios: Incorporates profitability, leverage, and efficiency ratios pertinent to Seven Bank, Ltd. (8410T).
- Dashboard and Charts: A visual overview of valuation outcomes and assumptions for straightforward result analysis.
Disclaimer
All information, articles, and product details provided on this website are for general informational and educational purposes only. We do not claim any ownership over, nor do we intend to infringe upon, any trademarks, copyrights, logos, brand names, or other intellectual property mentioned or depicted on this site. Such intellectual property remains the property of its respective owners, and any references here are made solely for identification or informational purposes, without implying any affiliation, endorsement, or partnership.
We make no representations or warranties, express or implied, regarding the accuracy, completeness, or suitability of any content or products presented. Nothing on this website should be construed as legal, tax, investment, financial, medical, or other professional advice. In addition, no part of this site—including articles or product references—constitutes a solicitation, recommendation, endorsement, advertisement, or offer to buy or sell any securities, franchises, or other financial instruments, particularly in jurisdictions where such activity would be unlawful.
All content is of a general nature and may not address the specific circumstances of any individual or entity. It is not a substitute for professional advice or services. Any actions you take based on the information provided here are strictly at your own risk. You accept full responsibility for any decisions or outcomes arising from your use of this website and agree to release us from any liability in connection with your use of, or reliance upon, the content or products found herein.