
|
Banco Central Shinkin (8421.T) Avaliação DCF |
Totalmente Editável: Adapte-Se Às Suas Necessidades No Excel Ou Planilhas
Design Profissional: Modelos Confiáveis E Padrão Da Indústria
Pré-Construídos Para Uso Rápido E Eficiente
Compatível com MAC/PC, totalmente desbloqueado
Não É Necessária Experiência; Fácil De Seguir
Shinkin Central Bank (8421.T) Bundle
Descubra o verdadeiro potencial do Shinkin Central Bank (8421T) com nossa calculadora DCF avançada! Ajuste as principais suposições, explore vários cenários e examine como as mudanças afetam a avaliação do Banco Central Shinkin (8421T) - tudo dentro de um único modelo do Excel.
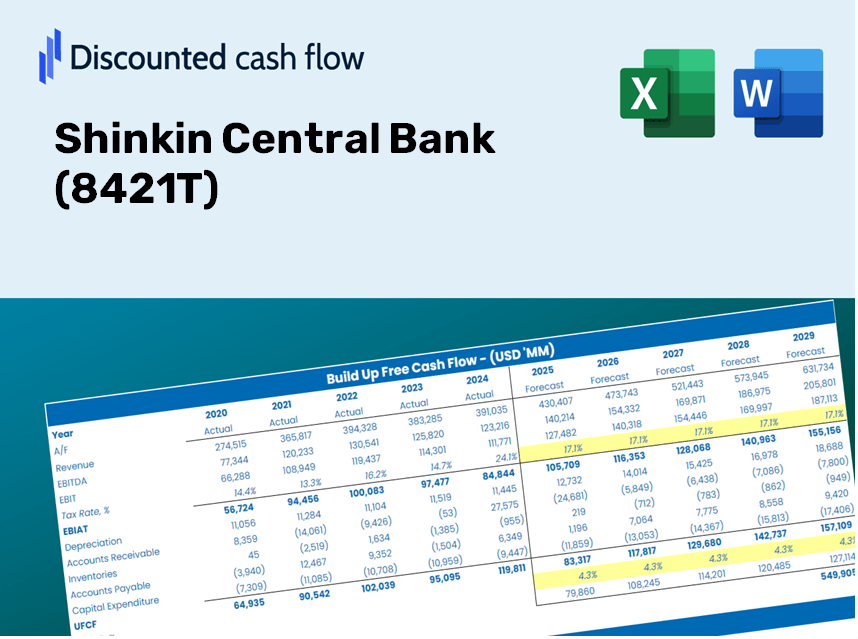
Discounted Cash Flow (DCF) - (USD MM)
| Year | AY1 2021 |
AY2 2022 |
AY3 2023 |
AY4 2024 |
AY5 2025 |
FY1 2026 |
FY2 2027 |
FY3 2028 |
FY4 2029 |
FY5 2030 |
|---|---|---|---|---|---|---|---|---|---|---|
| Revenue | 160,899.0 | 230,153.0 | 251,861.0 | 411,868.0 | 163,620.0 | 186,416.4 | 212,388.9 | 241,980.0 | 275,694.0 | 314,105.1 |
| Revenue Growth, % | 0 | 43.04 | 9.43 | 63.53 | -60.27 | 13.93 | 13.93 | 13.93 | 13.93 | 13.93 |
| EBITDA | 53,683.0 | 57,957.0 | 45,508.0 | 54,705.0 | 69,255.0 | 49,297.4 | 56,165.8 | 63,991.1 | 72,906.7 | 83,064.4 |
| EBITDA, % | 33.36 | 25.18 | 18.07 | 13.28 | 42.33 | 26.44 | 26.44 | 26.44 | 26.44 | 26.44 |
| Depreciation | 10,259.0 | 9,776.0 | 9,858.0 | 10,626.0 | 10,948.0 | 8,876.7 | 10,113.4 | 11,522.5 | 13,127.9 | 14,956.9 |
| Depreciation, % | 6.38 | 4.25 | 3.91 | 2.58 | 6.69 | 4.76 | 4.76 | 4.76 | 4.76 | 4.76 |
| EBIT | 43,424.0 | 48,181.0 | 35,650.0 | 44,079.0 | 58,307.0 | 40,420.7 | 46,052.4 | 52,468.6 | 59,778.8 | 68,107.5 |
| EBIT, % | 26.99 | 20.93 | 14.15 | 10.7 | 35.64 | 21.68 | 21.68 | 21.68 | 21.68 | 21.68 |
| Total Cash | 15,063,421.0 | 16,764,225.0 | 19,019,069.0 | 19,937,781.0 | 19,119,691.0 | 186,416.4 | 212,388.9 | 241,980.0 | 275,694.0 | 314,105.1 |
| Total Cash, percent | .0 | .0 | .0 | .0 | .0 | .0 | .0 | .0 | .0 | .0 |
| Account Receivables | .0 | .0 | .0 | .0 | .0 | .0 | .0 | .0 | .0 | .0 |
| Account Receivables, % | 0 | 0 | 0 | 0 | 0 | 0 | 0 | 0 | 0 | 0 |
| Inventories | .0 | .0 | .0 | .0 | .0 | .0 | .0 | .0 | .0 | .0 |
| Inventories, % | 0 | 0 | 0 | 0 | 0 | 0 | 0 | 0 | 0 | 0 |
| Accounts Payable | .0 | .0 | .0 | .0 | .0 | .0 | .0 | .0 | .0 | .0 |
| Accounts Payable, % | 0 | 0 | 0 | 0 | 0 | 0 | 0 | 0 | 0 | 0 |
| Capital Expenditure | -7,761.0 | -6,733.0 | -12,980.0 | -6,609.0 | -5,886.0 | -6,750.0 | -7,690.4 | -8,761.9 | -9,982.7 | -11,373.5 |
| Capital Expenditure, % | -4.82 | -2.93 | -5.15 | -1.6 | -3.6 | -3.62 | -3.62 | -3.62 | -3.62 | -3.62 |
| Tax Rate, % | 27.2 | 27.2 | 27.2 | 27.2 | 27.2 | 27.2 | 27.2 | 27.2 | 27.2 | 27.2 |
| EBITAT | 31,647.5 | 35,942.0 | 26,221.0 | 32,145.0 | 42,449.7 | 29,649.3 | 33,780.2 | 38,486.7 | 43,848.8 | 49,958.1 |
| Depreciation | ||||||||||
| Changes in Account Receivables | ||||||||||
| Changes in Inventories | ||||||||||
| Changes in Accounts Payable | ||||||||||
| Capital Expenditure | ||||||||||
| UFCF | 34,145.5 | 38,985.0 | 23,099.0 | 36,162.0 | 47,511.7 | 31,776.0 | 36,203.2 | 41,247.3 | 46,994.1 | 53,541.5 |
| WACC, % | 3.07 | 3.12 | 3.09 | 3.07 | 3.06 | 3.08 | 3.08 | 3.08 | 3.08 | 3.08 |
| PV UFCF | ||||||||||
| SUM PV UFCF | 190,175.5 | |||||||||
| Long Term Growth Rate, % | 2.00 | |||||||||
| Free cash flow (T + 1) | 54,612 | |||||||||
| Terminal Value | 5,046,366 | |||||||||
| Present Terminal Value | 4,335,709 | |||||||||
| Enterprise Value | 4,525,885 | |||||||||
| Net Debt | -10,689,373 | |||||||||
| Equity Value | 15,215,258 | |||||||||
| Diluted Shares Outstanding, MM | 9 | |||||||||
| Equity Value Per Share | 1,747,273.51 |
What You Will Receive
- Pre-Filled Financial Model: Utilize Shinkin Central Bank's actual data for accurate DCF valuation.
- Comprehensive Forecast Control: Modify revenue growth rates, margins, WACC, and other significant variables.
- Real-Time Calculations: Instant updates guarantee you see results immediately as adjustments are made.
- Professional-Grade Template: A polished Excel file crafted for serious investment valuations.
- Customizable and Reusable: Designed for versatility, enabling repeated use for in-depth forecasts.
Key Features
- 🔍 Real-Life SCB Financials: Pre-filled historical and projected data for Shinkin Central Bank (8421T).
- ✏️ Fully Customizable Inputs: Modify all essential parameters (yellow cells) such as WACC, growth %, and tax rates.
- 📊 Professional DCF Valuation: Integrated formulas to calculate the intrinsic value of Shinkin Central Bank (8421T) using the Discounted Cash Flow method.
- ⚡ Instant Results: Visualize the valuation of Shinkin Central Bank (8421T) immediately after adjustments.
- Scenario Analysis: Assess and compare results for different financial assumptions side-by-side.
How It Functions
- Step 1: Download the Excel file.
- Step 2: Examine the pre-filled data for Shinkin Central Bank (8421T) (historical and forecasted).
- Step 3: Modify key assumptions (highlighted in yellow) based on your insights.
- Step 4: Observe automatic recalculations for the intrinsic value of Shinkin Central Bank (8421T).
- Step 5: Utilize the results for investment strategies or reporting purposes.
Why Opt for This Calculator?
- User-Friendly Interface: Perfectly crafted for both novices and seasoned professionals.
- Customizable Inputs: Easily adjust parameters to suit your financial analysis.
- Real-Time Updates: Instantly view changes in Shinkin Central Bank’s valuation as you modify inputs.
- Preloaded Data: Comes equipped with Shinkin Central Bank’s actual financial figures for swift assessments.
- Preferred by Experts: Widely utilized by investors and analysts for informed decision-making.
Who Can Benefit from This Product?
- Investors: Evaluate the fair value of Shinkin Central Bank (8421T) effectively before making investment choices.
- CFOs: Utilize a robust DCF model for accurate financial reporting and analysis related to Shinkin Central Bank (8421T).
- Consultants: Tailor the template swiftly for client valuation reports focused on Shinkin Central Bank (8421T).
- Entrepreneurs: Acquire valuable insights into the financial modeling techniques employed by leading firms, including Shinkin Central Bank (8421T).
- Educators: Implement it as a teaching resource to illustrate valuation methodologies relevant to Shinkin Central Bank (8421T).
Contents of the Template
- Pre-Populated Information: Features Shinkin Central Bank's historical financial data and projections.
- Discounted Cash Flow Model: An adjustable DCF valuation model with real-time calculations.
- Weighted Average Cost of Capital (WACC): A specific sheet for calculating WACC using personalized inputs.
- Key Financial Metrics: Evaluate Shinkin Central Bank's profitability, efficiency, and leverage ratios.
- Customizable Parameters: Easily modify revenue growth rates, profit margins, and tax assumptions.
- User-Friendly Dashboard: Visuals and tables that encapsulate essential valuation insights.
Disclaimer
All information, articles, and product details provided on this website are for general informational and educational purposes only. We do not claim any ownership over, nor do we intend to infringe upon, any trademarks, copyrights, logos, brand names, or other intellectual property mentioned or depicted on this site. Such intellectual property remains the property of its respective owners, and any references here are made solely for identification or informational purposes, without implying any affiliation, endorsement, or partnership.
We make no representations or warranties, express or implied, regarding the accuracy, completeness, or suitability of any content or products presented. Nothing on this website should be construed as legal, tax, investment, financial, medical, or other professional advice. In addition, no part of this site—including articles or product references—constitutes a solicitation, recommendation, endorsement, advertisement, or offer to buy or sell any securities, franchises, or other financial instruments, particularly in jurisdictions where such activity would be unlawful.
All content is of a general nature and may not address the specific circumstances of any individual or entity. It is not a substitute for professional advice or services. Any actions you take based on the information provided here are strictly at your own risk. You accept full responsibility for any decisions or outcomes arising from your use of this website and agree to release us from any liability in connection with your use of, or reliance upon, the content or products found herein.