
|
ACOM Co., Ltd. (8572.T) Avaliação DCF |
Totalmente Editável: Adapte-Se Às Suas Necessidades No Excel Ou Planilhas
Design Profissional: Modelos Confiáveis E Padrão Da Indústria
Pré-Construídos Para Uso Rápido E Eficiente
Compatível com MAC/PC, totalmente desbloqueado
Não É Necessária Experiência; Fácil De Seguir
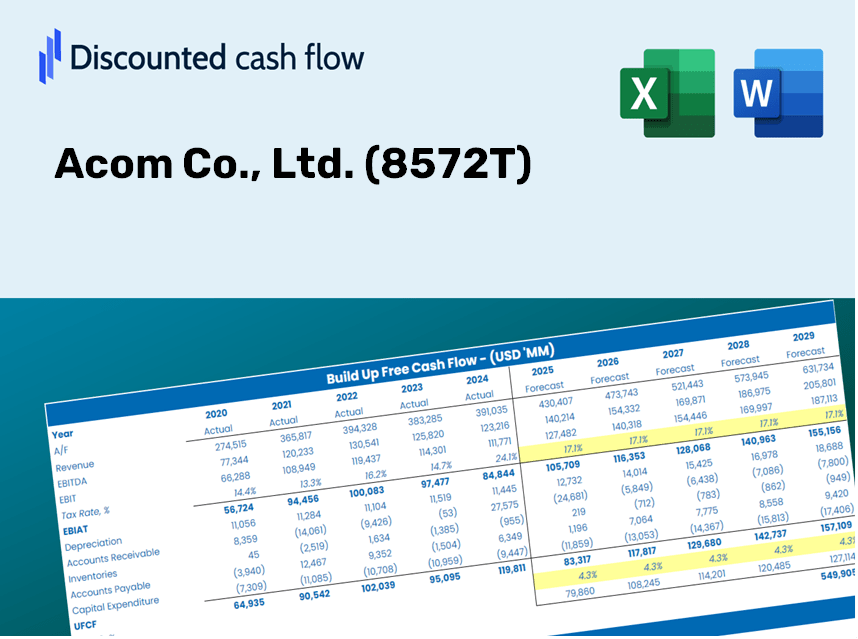
Acom Co., Ltd. (8572.T) Bundle
Seja você um investidor ou analista, esta calculadora DCF (8572T) é o seu recurso preferido para uma avaliação precisa. Equipado com dados reais da ACOM Co., Ltd., você pode ajustar as previsões e observar imediatamente os efeitos.
Discounted Cash Flow (DCF) - (USD MM)
| Year | AY1 2020 |
AY2 2021 |
AY3 2022 |
AY4 2023 |
AY5 2024 |
FY1 2025 |
FY2 2026 |
FY3 2027 |
FY4 2028 |
FY5 2029 |
|---|---|---|---|---|---|---|---|---|---|---|
| Revenue | 266,312.0 | 262,151.0 | 273,791.0 | 294,726.0 | 317,739.0 | 332,301.3 | 347,530.9 | 363,458.6 | 380,116.2 | 397,537.2 |
| Revenue Growth, % | 0 | -1.56 | 4.44 | 7.65 | 7.81 | 4.58 | 4.58 | 4.58 | 4.58 | 4.58 |
| EBITDA | 103,147.0 | 42,833.0 | 94,920.0 | 94,553.0 | 67,676.0 | 95,118.2 | 99,477.5 | 104,036.7 | 108,804.7 | 113,791.4 |
| EBITDA, % | 38.73 | 16.34 | 34.67 | 32.08 | 21.3 | 28.62 | 28.62 | 28.62 | 28.62 | 28.62 |
| Depreciation | 3,835.0 | 3,803.0 | 4,165.0 | 3,980.0 | 4,067.0 | 4,680.4 | 4,894.9 | 5,119.2 | 5,353.8 | 5,599.2 |
| Depreciation, % | 1.44 | 1.45 | 1.52 | 1.35 | 1.28 | 1.41 | 1.41 | 1.41 | 1.41 | 1.41 |
| EBIT | 99,312.0 | 39,030.0 | 90,755.0 | 90,573.0 | 63,609.0 | 90,437.8 | 94,582.6 | 98,917.4 | 103,450.9 | 108,192.2 |
| EBIT, % | 37.29 | 14.89 | 33.15 | 30.73 | 20.02 | 27.22 | 27.22 | 27.22 | 27.22 | 27.22 |
| Total Cash | 83,323.0 | 74,242.0 | 57,666.0 | 73,486.0 | 60,268.0 | 82,790.6 | 86,584.9 | 90,553.2 | 94,703.3 | 99,043.7 |
| Total Cash, percent | .0 | .0 | .0 | .0 | .0 | .0 | .0 | .0 | .0 | .0 |
| Account Receivables | 987,624.0 | 994,278.0 | 1,058,235.0 | 1,160,535.0 | 1,249,176.0 | 332,301.3 | 347,530.9 | 363,458.6 | 380,116.2 | 397,537.2 |
| Account Receivables, % | 370.85 | 379.28 | 386.51 | 393.77 | 393.15 | 100 | 100 | 100 | 100 | 100 |
| Inventories | 63.0 | 60,565.0 | 83,418.0 | .0 | .0 | 35,619.1 | 37,251.5 | 38,958.8 | 40,744.3 | 42,611.6 |
| Inventories, % | 0.02365646 | 23.1 | 30.47 | 0 | 0 | 10.72 | 10.72 | 10.72 | 10.72 | 10.72 |
| Accounts Payable | 696.0 | 797.0 | 344.0 | 769.0 | 816.0 | 803.3 | 840.2 | 878.7 | 918.9 | 961.0 |
| Accounts Payable, % | 0.26135 | 0.30402 | 0.12564 | 0.26092 | 0.25681 | 0.24175 | 0.24175 | 0.24175 | 0.24175 | 0.24175 |
| Capital Expenditure | -3,348.0 | -4,483.0 | -4,680.0 | -4,635.0 | -1,363.0 | -4,438.4 | -4,641.8 | -4,854.5 | -5,077.0 | -5,309.7 |
| Capital Expenditure, % | -1.26 | -1.71 | -1.71 | -1.57 | -0.42897 | -1.34 | -1.34 | -1.34 | -1.34 | -1.34 |
| Tax Rate, % | 45.22 | 45.22 | 45.22 | 45.22 | 45.22 | 45.22 | 45.22 | 45.22 | 45.22 | 45.22 |
| EBITAT | 78,875.9 | 64,434.3 | 58,781.0 | 55,439.6 | 34,846.6 | 65,148.4 | 68,134.2 | 71,256.9 | 74,522.7 | 77,938.1 |
| Depreciation | ||||||||||
| Changes in Account Receivables | ||||||||||
| Changes in Inventories | ||||||||||
| Changes in Accounts Payable | ||||||||||
| Capital Expenditure | ||||||||||
| UFCF | -907,628.1 | -3,300.7 | -28,997.0 | 36,327.6 | -51,043.4 | 946,633.5 | 51,562.1 | 53,925.2 | 56,396.6 | 58,981.3 |
| WACC, % | 3.84 | 4.21 | 3.58 | 3.52 | 3.4 | 3.71 | 3.71 | 3.71 | 3.71 | 3.71 |
| PV UFCF | ||||||||||
| SUM PV UFCF | 1,106,932.5 | |||||||||
| Long Term Growth Rate, % | 2.00 | |||||||||
| Free cash flow (T + 1) | 60,161 | |||||||||
| Terminal Value | 3,514,402 | |||||||||
| Present Terminal Value | 2,928,935 | |||||||||
| Enterprise Value | 4,035,867 | |||||||||
| Net Debt | 627,939 | |||||||||
| Equity Value | 3,407,928 | |||||||||
| Diluted Shares Outstanding, MM | 1,567 | |||||||||
| Equity Value Per Share | 2,175.35 |
What You Will Receive
- Comprehensive Financial Model: Leverage Acom Co., Ltd.'s actual data for accurate DCF valuation.
- Complete Forecast Flexibility: Modify revenue growth, profit margins, WACC, and other essential drivers.
- Real-Time Calculations: Automatic updates provide immediate insights as you adjust parameters.
- Professional-Grade Template: A polished Excel file crafted for serious investment valuation.
- Flexible and Reusable: Designed for adaptability, allowing for repeated use in detailed forecasting.
Key Features
- Comprehensive DCF Calculator: Offers detailed unlevered and levered DCF valuation frameworks.
- Customizable WACC Tool: Features a pre-structured Weighted Average Cost of Capital worksheet with adjustable parameters.
- Modifiable Forecast Assumptions: Change growth forecasts, capital investments, and discount rates as needed.
- Integrated Financial Ratios: Evaluate profitability, leverage, and efficiency ratios specific to Acom Co., Ltd. (8572T).
- User-Friendly Dashboard and Charts: Visual representations highlight essential valuation metrics for streamlined analysis.
How It Works
- Step 1: Download the Excel file.
- Step 2: Examine the pre-filled data for Acom Co., Ltd. (8572T) including both historical and projected figures.
- Step 3: Modify the key assumptions (highlighted in yellow) based on your assessment.
- Step 4: Observe the automatic recalculations reflecting Acom Co., Ltd.'s (8572T) intrinsic value.
- Step 5: Utilize the results for making informed investment decisions or for reporting purposes.
Why Choose Acom Co., Ltd. Calculator?
- Designed for Experts: A sophisticated tool favored by financial analysts, CFOs, and consultants.
- Comprehensive Data: Acom Co., Ltd.’s historical and forecasted financial information preloaded for precision.
- Flexible Scenario Analysis: Effortlessly simulate various projections and assumptions.
- Clear Results: Instantly calculates intrinsic value, NPV, and other essential metrics.
- User-Friendly: Easy-to-follow instructions walk you through each step.
Who Can Benefit from Acom Co., Ltd. (8572T)?
- Professional Investors: Develop comprehensive and trustworthy valuation models to assess investment portfolios.
- Corporate Finance Teams: Evaluate valuation scenarios to inform strategic decision-making within the company.
- Consultants and Advisors: Deliver precise valuation insights on Acom Co., Ltd. (8572T) to support client recommendations.
- Students and Educators: Utilize real-time data for practicing and teaching financial modeling concepts.
- Finance Enthusiasts: Gain insights into the market valuation of companies like Acom Co., Ltd. (8572T).
Contents of the Template
- Operating and Balance Sheet Data: Pre-filled historical data and forecasts for Acom Co., Ltd. (8572T), including revenue, EBITDA, EBIT, and capital expenditures.
- WACC Calculation: A specific sheet for the Weighted Average Cost of Capital (WACC), featuring parameters such as Beta, risk-free rate, and share price.
- DCF Valuation (Unlevered and Levered): Editable Discounted Cash Flow models that illustrate intrinsic value along with detailed calculations.
- Financial Statements: Pre-loaded annual and quarterly financial statements to facilitate analysis.
- Key Ratios: Includes profitability, leverage, and efficiency ratios specific to Acom Co., Ltd. (8572T).
- Dashboard and Charts: A visual summary of valuation outputs and assumptions to simplify the analysis of results.
Disclaimer
All information, articles, and product details provided on this website are for general informational and educational purposes only. We do not claim any ownership over, nor do we intend to infringe upon, any trademarks, copyrights, logos, brand names, or other intellectual property mentioned or depicted on this site. Such intellectual property remains the property of its respective owners, and any references here are made solely for identification or informational purposes, without implying any affiliation, endorsement, or partnership.
We make no representations or warranties, express or implied, regarding the accuracy, completeness, or suitability of any content or products presented. Nothing on this website should be construed as legal, tax, investment, financial, medical, or other professional advice. In addition, no part of this site—including articles or product references—constitutes a solicitation, recommendation, endorsement, advertisement, or offer to buy or sell any securities, franchises, or other financial instruments, particularly in jurisdictions where such activity would be unlawful.
All content is of a general nature and may not address the specific circumstances of any individual or entity. It is not a substitute for professional advice or services. Any actions you take based on the information provided here are strictly at your own risk. You accept full responsibility for any decisions or outcomes arising from your use of this website and agree to release us from any liability in connection with your use of, or reliance upon, the content or products found herein.