
|
Mitsubishi HC Capital Inc. (8593.T) Avaliação DCF |
Totalmente Editável: Adapte-Se Às Suas Necessidades No Excel Ou Planilhas
Design Profissional: Modelos Confiáveis E Padrão Da Indústria
Pré-Construídos Para Uso Rápido E Eficiente
Compatível com MAC/PC, totalmente desbloqueado
Não É Necessária Experiência; Fácil De Seguir
Mitsubishi HC Capital Inc. (8593.T) Bundle
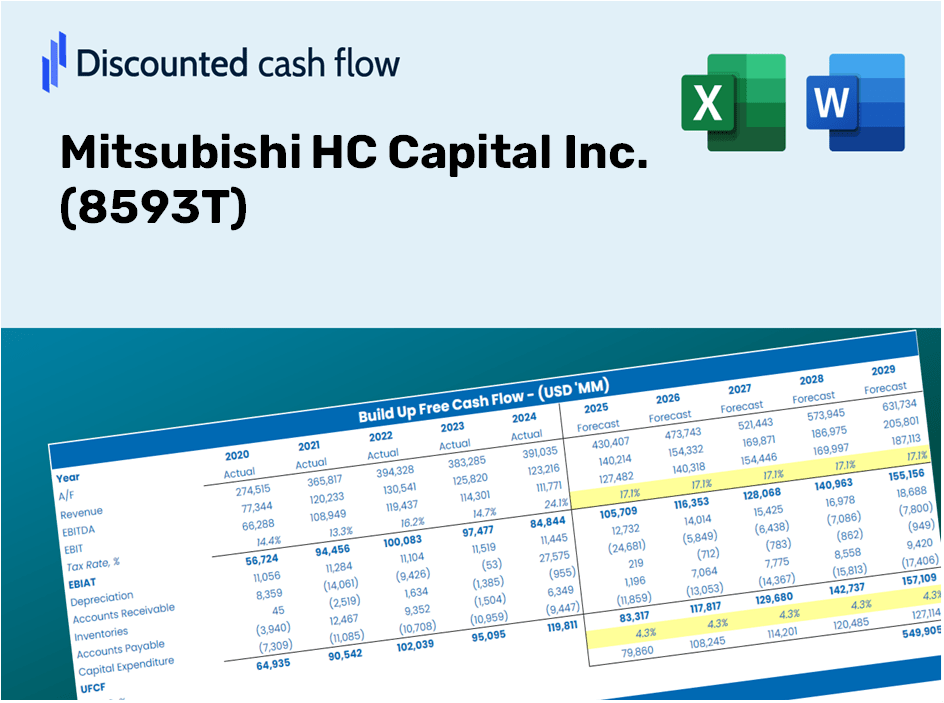
Ganhe domínio sobre sua análise de avaliação Mitsubishi HC Capital Inc. (8593T) usando nossa calculadora DCF de última geração! Apresentando dados em tempo real para (8593T), este modelo do Excel permite ajustar as previsões e suposições para um cálculo preciso do valor intrínseco da Mitsubishi HC Capital Inc.
Discounted Cash Flow (DCF) - (USD MM)
| Year | AY1 2021 |
AY2 2022 |
AY3 2023 |
AY4 2024 |
AY5 2025 |
FY1 2026 |
FY2 2027 |
FY3 2028 |
FY4 2029 |
FY5 2030 |
|---|---|---|---|---|---|---|---|---|---|---|
| Revenue | 947,658.0 | 1,765,559.0 | 1,896,231.0 | 1,950,583.0 | 2,090,808.0 | 2,633,184.4 | 3,316,258.6 | 4,176,529.0 | 5,259,962.1 | 6,624,448.6 |
| Revenue Growth, % | 0 | 86.31 | 7.4 | 2.87 | 7.19 | 25.94 | 25.94 | 25.94 | 25.94 | 25.94 |
| EBITDA | 214,222.0 | 442,779.0 | 491,985.0 | 495,494.0 | 576,409.0 | 666,725.4 | 839,680.6 | 1,057,502.1 | 1,331,828.6 | 1,677,318.2 |
| EBITDA, % | 22.61 | 25.08 | 25.95 | 25.4 | 27.57 | 25.32 | 25.32 | 25.32 | 25.32 | 25.32 |
| Depreciation | 151,807.0 | 328,687.0 | 350,106.0 | 349,317.0 | 389,281.0 | 472,003.9 | 594,446.3 | 748,651.6 | 942,859.3 | 1,187,446.4 |
| Depreciation, % | 16.02 | 18.62 | 18.46 | 17.91 | 18.62 | 17.93 | 17.93 | 17.93 | 17.93 | 17.93 |
| EBIT | 62,415.0 | 114,092.0 | 141,879.0 | 146,177.0 | 187,128.0 | 194,721.5 | 245,234.2 | 308,850.4 | 388,969.3 | 489,871.8 |
| EBIT, % | 6.59 | 6.46 | 7.48 | 7.49 | 8.95 | 7.39 | 7.39 | 7.39 | 7.39 | 7.39 |
| Total Cash | 299,710.0 | 542,961.0 | 592,901.0 | 369,043.0 | 316,131.0 | 672,443.2 | 846,881.7 | 1,066,571.2 | 1,343,250.4 | 1,691,702.9 |
| Total Cash, percent | .0 | .0 | .0 | .0 | .0 | .0 | .0 | .0 | .0 | .0 |
| Account Receivables | 2,712,323.0 | 5,424,110.0 | 5,462,213.0 | 5,439,359.0 | 5,551,501.0 | 2,633,184.4 | 3,316,258.6 | 4,176,529.0 | 5,259,962.1 | 6,624,448.6 |
| Account Receivables, % | 286.21 | 307.22 | 288.06 | 278.86 | 265.52 | 100 | 100 | 100 | 100 | 100 |
| Inventories | 27,468.0 | 48,242.0 | 46,064.0 | 38,240.0 | 49,278.0 | 65,184.3 | 82,093.8 | 103,389.8 | 130,210.1 | 163,987.9 |
| Inventories, % | 2.9 | 2.73 | 2.43 | 1.96 | 2.36 | 2.48 | 2.48 | 2.48 | 2.48 | 2.48 |
| Accounts Payable | 8,200.0 | 184,042.0 | 160,678.0 | 171,616.0 | 175,455.0 | 194,606.9 | 245,089.9 | 308,668.6 | 388,740.3 | 489,583.4 |
| Accounts Payable, % | 0.86529 | 10.42 | 8.47 | 8.8 | 8.39 | 7.39 | 7.39 | 7.39 | 7.39 | 7.39 |
| Capital Expenditure | -2,648.0 | -9,623.0 | -8,793.0 | -7,532.0 | -6,982.0 | -10,576.2 | -13,319.8 | -16,775.1 | -21,126.7 | -26,607.1 |
| Capital Expenditure, % | -0.27943 | -0.54504 | -0.46371 | -0.38614 | -0.33394 | -0.40165 | -0.40165 | -0.40165 | -0.40165 | -0.40165 |
| Tax Rate, % | 30.93 | 30.93 | 30.93 | 30.93 | 30.93 | 30.93 | 30.93 | 30.93 | 30.93 | 30.93 |
| EBITAT | 41,487.0 | 77,017.7 | 107,676.5 | 107,963.3 | 129,255.4 | 137,395.1 | 173,036.7 | 217,924.1 | 274,455.8 | 345,652.4 |
| Depreciation | ||||||||||
| Changes in Account Receivables | ||||||||||
| Changes in Inventories | ||||||||||
| Changes in Accounts Payable | ||||||||||
| Capital Expenditure | ||||||||||
| UFCF | -2,540,945.0 | -2,160,637.3 | 389,700.5 | 491,364.3 | 392,213.4 | 3,520,384.9 | 104,662.6 | 131,813.1 | 166,006.7 | 209,070.5 |
| WACC, % | 2.76 | 2.79 | 3.04 | 2.98 | 2.83 | 2.88 | 2.88 | 2.88 | 2.88 | 2.88 |
| PV UFCF | ||||||||||
| SUM PV UFCF | 3,971,402.6 | |||||||||
| Long Term Growth Rate, % | 2.00 | |||||||||
| Free cash flow (T + 1) | 213,252 | |||||||||
| Terminal Value | 24,257,527 | |||||||||
| Present Terminal Value | 21,047,978 | |||||||||
| Enterprise Value | 25,019,381 | |||||||||
| Net Debt | 8,570,209 | |||||||||
| Equity Value | 16,449,172 | |||||||||
| Diluted Shares Outstanding, MM | 1,438 | |||||||||
| Equity Value Per Share | 11,437.21 |
Benefits You Will Receive
- Pre-Configured Financial Model: Utilize Mitsubishi HC Capital Inc.'s actual data for an accurate DCF valuation.
- Comprehensive Forecast Control: Modify revenue growth, margins, WACC, and other essential factors as you see fit.
- Real-Time Calculations: Instant updates allow you to view results immediately as you make adjustments.
- Professional-Grade Template: An expertly crafted Excel file suitable for serious investment evaluations.
- Flexible and Reusable: Designed with adaptability in mind, enabling multiple uses for in-depth forecasting.
Key Features
- Real-Time Mitsubishi HC Capital Data: Pre-populated with historical financials and prospective forecasts for Mitsubishi HC Capital Inc. (8593T).
- Comprehensive Customization: Modify parameters such as revenue growth, profit margins, WACC, tax rates, and capital expenditures.
- Interactive Valuation Model: Automatically calculates Net Present Value (NPV) and intrinsic value based on your customized inputs.
- Scenario Analysis: Develop various forecasting scenarios to explore multiple valuation possibilities.
- User-Friendly Interface: Intuitive and organized layout suitable for both seasoned professionals and newcomers.
How It Works
- Step 1: Download the prebuilt Excel template featuring Mitsubishi HC Capital Inc. (8593T) data.
- Step 2: Review the pre-filled sheets to familiarize yourself with the key metrics.
- Step 3: Modify forecasts and assumptions in the editable yellow cells (WACC, growth, margins).
- Step 4: Instantly see recalculated results, including Mitsubishi HC Capital Inc.'s (8593T) intrinsic value.
- Step 5: Make well-informed investment decisions or create reports based on the generated outputs.
Why Choose This Calculator for Mitsubishi HC Capital Inc. (8593T)?
- User-Friendly Interface: Tailored for both novices and seasoned professionals.
- Customizable Variables: Easily adjust inputs to suit your specific analysis needs.
- Real-Time Calculations: Instantly see how changes affect Mitsubishi's valuation as you modify inputs.
- Pre-Configured Data: Comes loaded with Mitsubishi's actual financial metrics for swift evaluations.
- Preferred by Experts: Widely utilized by investors and analysts for well-informed decision-making.
Who Can Benefit from This Product?
- Finance Students: Master valuation techniques and put them into practice using real-world data.
- Academics: Integrate industry-standard models into your teaching materials or research projects.
- Investors: Evaluate your assumptions and analyze valuation results for Mitsubishi HC Capital Inc. (8593T).
- Analysts: Enhance your efficiency with a customizable DCF model designed for your needs.
- Small Business Owners: Discover how major public firms like Mitsubishi HC Capital Inc. (8593T) are evaluated.
Contents of the Template
- Pre-Populated Data: Features Mitsubishi HC Capital Inc.'s historical financial performance and projections.
- Discounted Cash Flow Model: An editable DCF valuation model with automatic calculation capabilities.
- Weighted Average Cost of Capital (WACC): A specific sheet for computing WACC using customized inputs.
- Essential Financial Ratios: Assess Mitsubishi HC Capital Inc.'s profitability, efficiency, and capital structure.
- Adjustable Inputs: Easily modify revenue growth, profit margins, and tax rates.
- Comprehensive Dashboard: Visuals and tables that summarize the key valuation outcomes.
Disclaimer
All information, articles, and product details provided on this website are for general informational and educational purposes only. We do not claim any ownership over, nor do we intend to infringe upon, any trademarks, copyrights, logos, brand names, or other intellectual property mentioned or depicted on this site. Such intellectual property remains the property of its respective owners, and any references here are made solely for identification or informational purposes, without implying any affiliation, endorsement, or partnership.
We make no representations or warranties, express or implied, regarding the accuracy, completeness, or suitability of any content or products presented. Nothing on this website should be construed as legal, tax, investment, financial, medical, or other professional advice. In addition, no part of this site—including articles or product references—constitutes a solicitation, recommendation, endorsement, advertisement, or offer to buy or sell any securities, franchises, or other financial instruments, particularly in jurisdictions where such activity would be unlawful.
All content is of a general nature and may not address the specific circumstances of any individual or entity. It is not a substitute for professional advice or services. Any actions you take based on the information provided here are strictly at your own risk. You accept full responsibility for any decisions or outcomes arising from your use of this website and agree to release us from any liability in connection with your use of, or reliance upon, the content or products found herein.