
|
Monex Group, Inc. (8698.T) Avaliação DCF |
Totalmente Editável: Adapte-Se Às Suas Necessidades No Excel Ou Planilhas
Design Profissional: Modelos Confiáveis E Padrão Da Indústria
Pré-Construídos Para Uso Rápido E Eficiente
Compatível com MAC/PC, totalmente desbloqueado
Não É Necessária Experiência; Fácil De Seguir
Monex Group, Inc. (8698.T) Bundle
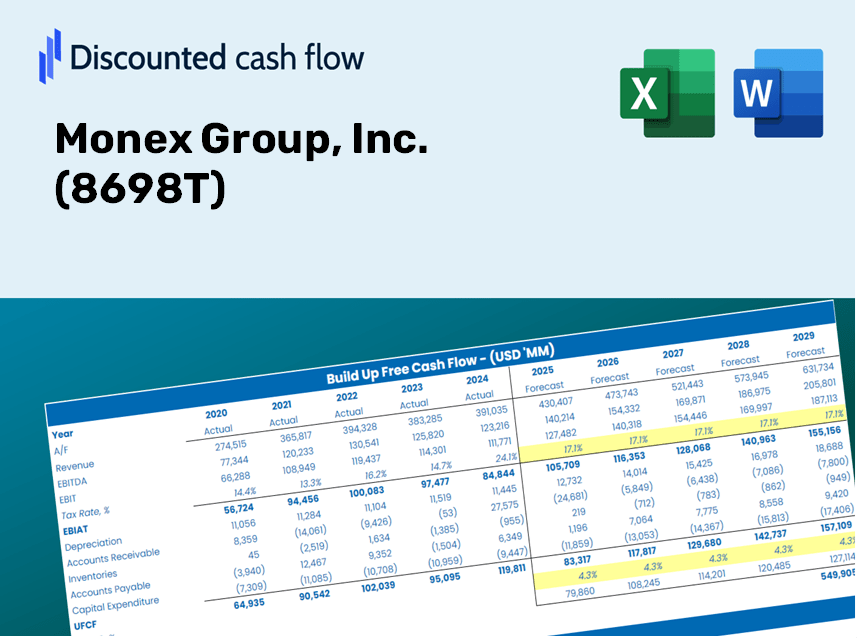
Procurando avaliar o valor intrínseco do Monex Group, Inc.? Nossa calculadora DCF (8698T) integra dados do mundo real, juntamente com extensas opções de personalização, permitindo ajustar as previsões para aprimorar suas estratégias de investimento.
Discounted Cash Flow (DCF) - (USD MM)
| Year | AY1 2021 |
AY2 2022 |
AY3 2023 |
AY4 2024 |
AY5 2025 |
FY1 2026 |
FY2 2027 |
FY3 2028 |
FY4 2029 |
FY5 2030 |
|---|---|---|---|---|---|---|---|---|---|---|
| Revenue | 77,387.0 | 86,979.0 | 57,568.0 | 61,152.0 | 76,085.0 | 77,839.9 | 79,635.3 | 81,472.1 | 83,351.3 | 85,273.8 |
| Revenue Growth, % | 0 | 12.39 | -33.81 | 6.23 | 24.42 | 2.31 | 2.31 | 2.31 | 2.31 | 2.31 |
| EBITDA | 33,656.0 | 34,402.0 | 12,659.0 | 41,446.0 | 13,469.0 | 29,658.6 | 30,342.7 | 31,042.5 | 31,758.5 | 32,491.1 |
| EBITDA, % | 43.49 | 39.55 | 21.99 | 67.78 | 17.7 | 38.1 | 38.1 | 38.1 | 38.1 | 38.1 |
| Depreciation | 8,149.0 | 8,418.0 | 8,542.0 | 8,153.0 | 4,914.0 | 8,537.1 | 8,734.0 | 8,935.4 | 9,141.5 | 9,352.4 |
| Depreciation, % | 10.53 | 9.68 | 14.84 | 13.33 | 6.46 | 10.97 | 10.97 | 10.97 | 10.97 | 10.97 |
| EBIT | 25,507.0 | 25,984.0 | 4,117.0 | 33,293.0 | 8,555.0 | 21,121.5 | 21,608.7 | 22,107.1 | 22,617.0 | 23,138.7 |
| EBIT, % | 32.96 | 29.87 | 7.15 | 54.44 | 11.24 | 27.13 | 27.13 | 27.13 | 27.13 | 27.13 |
| Total Cash | 168,446.0 | 261,301.0 | 181,022.0 | 97,935.0 | 430,254.0 | 77,839.9 | 79,635.3 | 81,472.1 | 83,351.3 | 85,273.8 |
| Total Cash, percent | .0 | .0 | .0 | .0 | .0 | .0 | .0 | .0 | .0 | .0 |
| Account Receivables | 182,017.0 | 162,285.0 | 182,491.0 | 47,870.0 | 124,240.0 | 74,458.6 | 76,176.0 | 77,933.0 | 79,730.6 | 81,569.6 |
| Account Receivables, % | 235.2 | 186.58 | 317 | 78.28 | 163.29 | 95.66 | 95.66 | 95.66 | 95.66 | 95.66 |
| Inventories | 45,462.0 | 56,463.0 | 18,972.0 | 44,207.0 | .0 | 35,636.4 | 36,458.3 | 37,299.3 | 38,159.6 | 39,039.7 |
| Inventories, % | 58.75 | 64.92 | 32.96 | 72.29 | 0 | 45.78 | 45.78 | 45.78 | 45.78 | 45.78 |
| Accounts Payable | .0 | .0 | .0 | .0 | .0 | .0 | .0 | .0 | .0 | .0 |
| Accounts Payable, % | 0 | 0 | 0 | 0 | 0 | 0 | 0 | 0 | 0 | 0 |
| Capital Expenditure | -5,541.0 | -6,610.0 | -7,808.0 | -6,693.0 | -914.0 | -6,300.2 | -6,445.5 | -6,594.2 | -6,746.3 | -6,901.9 |
| Capital Expenditure, % | -7.16 | -7.6 | -13.56 | -10.94 | -1.2 | -8.09 | -8.09 | -8.09 | -8.09 | -8.09 |
| Tax Rate, % | 22.85 | 22.85 | 22.85 | 22.85 | 22.85 | 22.85 | 22.85 | 22.85 | 22.85 | 22.85 |
| EBITAT | 17,192.3 | 16,260.5 | 14,456.4 | 41,282.2 | 6,600.2 | 17,198.5 | 17,595.1 | 18,001.0 | 18,416.2 | 18,841.0 |
| Depreciation | ||||||||||
| Changes in Account Receivables | ||||||||||
| Changes in Inventories | ||||||||||
| Changes in Accounts Payable | ||||||||||
| Capital Expenditure | ||||||||||
| UFCF | -207,678.7 | 26,799.5 | 32,475.4 | 152,128.2 | -21,562.8 | 33,580.4 | 17,344.3 | 17,744.3 | 18,153.6 | 18,572.3 |
| WACC, % | 6.93 | 6.79 | 7.84 | 7.84 | 7.2 | 7.32 | 7.32 | 7.32 | 7.32 | 7.32 |
| PV UFCF | ||||||||||
| SUM PV UFCF | 87,430.9 | |||||||||
| Long Term Growth Rate, % | 2.00 | |||||||||
| Free cash flow (T + 1) | 18,944 | |||||||||
| Terminal Value | 355,962 | |||||||||
| Present Terminal Value | 250,013 | |||||||||
| Enterprise Value | 337,444 | |||||||||
| Net Debt | -386,433 | |||||||||
| Equity Value | 723,877 | |||||||||
| Diluted Shares Outstanding, MM | 256 | |||||||||
| Equity Value Per Share | 2,827.50 |
What You Will Receive
- Accurate Monex Group Financials: Access to historical and projected data for precise valuation.
- Customizable Inputs: Adjust parameters such as WACC, tax rates, revenue growth, and capital expenditures.
- Instant Calculations: Intrinsic value and NPV are automatically computed.
- Scenario Analysis: Evaluate various scenarios to forecast Monex Group’s future performance.
- User-Friendly Design: Tailored for professionals while remaining approachable for newcomers.
Key Features
- 🔍 Real-Life Monex Group Financials: Pre-filled historical and projected data for Monex Group, Inc. (8698T).
- ✏️ Fully Customizable Inputs: Adjust all essential parameters (yellow cells) like WACC, growth %, and tax rates.
- 📊 Professional DCF Valuation: Built-in formulas calculate Monex Group’s intrinsic value using the Discounted Cash Flow method.
- ⚡ Instant Results: Visualize Monex Group’s valuation immediately after making adjustments.
- Scenario Analysis: Test and compare outcomes for various financial assumptions side-by-side.
How It Works
- Step 1: Download the prebuilt Excel template featuring Monex Group, Inc.'s (8698T) data.
- Step 2: Review the pre-populated sheets to familiarize yourself with the key performance indicators.
- Step 3: Adjust forecasts and assumptions in the editable yellow cells (WACC, growth, margins).
- Step 4: Immediately see recalculated results, including the intrinsic value of Monex Group, Inc. (8698T).
- Step 5: Utilize the outputs to make informed investment decisions or create comprehensive reports.
Why Choose This Calculator for Monex Group, Inc. (8698T)?
- User-Friendly Interface: Crafted for both novices and seasoned professionals.
- Customizable Inputs: Adjust parameters easily to suit your analysis needs.
- Real-Time Valuation: Observe immediate updates to Monex’s valuation as you tweak inputs.
- Preloaded Financial Data: Comes with Monex’s actual financial figures for swift evaluations.
- Relied Upon by Experts: Utilized by investors and analysts for informed decision-making.
Who Can Benefit from Monex Group, Inc. (8698T)?
- Finance Students: Discover key trading strategies and apply them using market data.
- Researchers: Enhance your studies by integrating industry-standard trading models.
- Investors: Evaluate your strategies and analyze market trends relevant to Monex Group, Inc. (8698T).
- Financial Analysts: Optimize your analysis process with a ready-to-use, adaptable trading model.
- Entrepreneurs: Learn how established financial firms like Monex Group, Inc. (8698T) operate in the market.
Contents of the Template
- Historical Data: Contains Monex Group, Inc.'s (8698T) previous financial performance and foundational forecasts.
- DCF and Levered DCF Models: Comprehensive templates for calculating the intrinsic value of Monex Group, Inc. (8698T).
- WACC Sheet: Ready-to-use calculations for the Weighted Average Cost of Capital.
- Editable Inputs: Adjust essential drivers such as growth rates, EBITDA percentages, and CAPEX projections.
- Quarterly and Annual Statements: A thorough examination of Monex Group, Inc.'s (8698T) financial statements.
- Interactive Dashboard: Dynamically visualize valuation results and forecasts.
Disclaimer
All information, articles, and product details provided on this website are for general informational and educational purposes only. We do not claim any ownership over, nor do we intend to infringe upon, any trademarks, copyrights, logos, brand names, or other intellectual property mentioned or depicted on this site. Such intellectual property remains the property of its respective owners, and any references here are made solely for identification or informational purposes, without implying any affiliation, endorsement, or partnership.
We make no representations or warranties, express or implied, regarding the accuracy, completeness, or suitability of any content or products presented. Nothing on this website should be construed as legal, tax, investment, financial, medical, or other professional advice. In addition, no part of this site—including articles or product references—constitutes a solicitation, recommendation, endorsement, advertisement, or offer to buy or sell any securities, franchises, or other financial instruments, particularly in jurisdictions where such activity would be unlawful.
All content is of a general nature and may not address the specific circumstances of any individual or entity. It is not a substitute for professional advice or services. Any actions you take based on the information provided here are strictly at your own risk. You accept full responsibility for any decisions or outcomes arising from your use of this website and agree to release us from any liability in connection with your use of, or reliance upon, the content or products found herein.