
|
Mitsui Fudosan Co., Ltd. (8801.T) Avaliação DCF |
Totalmente Editável: Adapte-Se Às Suas Necessidades No Excel Ou Planilhas
Design Profissional: Modelos Confiáveis E Padrão Da Indústria
Pré-Construídos Para Uso Rápido E Eficiente
Compatível com MAC/PC, totalmente desbloqueado
Não É Necessária Experiência; Fácil De Seguir
Mitsui Fudosan Co., Ltd. (8801.T) Bundle
Projetado para precisão, nossa calculadora DCF (8801T) permite avaliar a avaliação Mitsui Fudosan Co., Ltd. usando dados financeiros do mundo real, com completa flexibilidade para modificar todos os parâmetros essenciais para obter projeções aprimoradas.
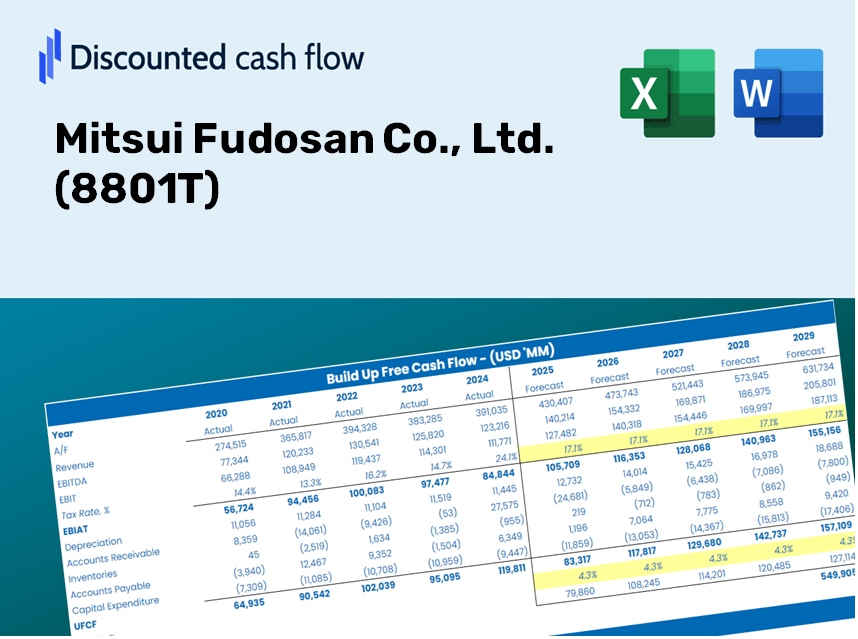
Discounted Cash Flow (DCF) - (USD MM)
| Year | AY1 2021 |
AY2 2022 |
AY3 2023 |
AY4 2024 |
AY5 2025 |
FY1 2026 |
FY2 2027 |
FY3 2028 |
FY4 2029 |
FY5 2030 |
|---|---|---|---|---|---|---|---|---|---|---|
| Revenue | 2,007,554.0 | 2,100,870.0 | 2,269,103.0 | 2,383,289.0 | 2,625,363.0 | 2,808,123.5 | 3,003,606.6 | 3,212,698.0 | 3,436,344.9 | 3,675,560.6 |
| Revenue Growth, % | 0 | 4.65 | 8.01 | 5.03 | 10.16 | 6.96 | 6.96 | 6.96 | 6.96 | 6.96 |
| EBITDA | 301,967.0 | 356,480.0 | 430,704.0 | 473,418.0 | 513,250.0 | 507,735.3 | 543,080.5 | 580,886.2 | 621,323.7 | 664,576.1 |
| EBITDA, % | 15.04 | 16.97 | 18.98 | 19.86 | 19.55 | 18.08 | 18.08 | 18.08 | 18.08 | 18.08 |
| Depreciation | 98,196.0 | 111,501.0 | 125,299.0 | 133,726.0 | 140,516.0 | 149,863.3 | 160,295.9 | 171,454.6 | 183,390.1 | 196,156.6 |
| Depreciation, % | 4.89 | 5.31 | 5.52 | 5.61 | 5.35 | 5.34 | 5.34 | 5.34 | 5.34 | 5.34 |
| EBIT | 203,771.0 | 244,979.0 | 305,405.0 | 339,692.0 | 372,734.0 | 357,872.0 | 382,784.6 | 409,431.6 | 437,933.5 | 468,419.6 |
| EBIT, % | 10.15 | 11.66 | 13.46 | 14.25 | 14.2 | 12.74 | 12.74 | 12.74 | 12.74 | 12.74 |
| Total Cash | 199,644.0 | 156,232.0 | 144,262.0 | 184,283.0 | 164,166.0 | 211,868.5 | 226,617.4 | 242,393.0 | 259,266.9 | 277,315.3 |
| Total Cash, percent | .0 | .0 | .0 | .0 | .0 | .0 | .0 | .0 | .0 | .0 |
| Account Receivables | 40,794.0 | 60,654.0 | 70,490.0 | 81,130.0 | 83,074.0 | 81,963.7 | 87,669.5 | 93,772.4 | 100,300.3 | 107,282.5 |
| Account Receivables, % | 2.03 | 2.89 | 3.11 | 3.4 | 3.16 | 2.92 | 2.92 | 2.92 | 2.92 | 2.92 |
| Inventories | 1,938,599.0 | 2,047,991.0 | 2,159,675.0 | 2,368,112.0 | 2,498,097.0 | 2,716,810.8 | 2,905,937.3 | 3,108,229.5 | 3,324,604.1 | 3,556,041.1 |
| Inventories, % | 96.57 | 97.48 | 95.18 | 99.36 | 95.15 | 96.75 | 96.75 | 96.75 | 96.75 | 96.75 |
| Accounts Payable | 97,970.0 | 135,098.0 | 147,986.0 | 131,202.0 | 197,043.0 | 173,221.2 | 185,279.7 | 198,177.6 | 211,973.5 | 226,729.7 |
| Accounts Payable, % | 4.88 | 6.43 | 6.52 | 5.51 | 7.51 | 6.17 | 6.17 | 6.17 | 6.17 | 6.17 |
| Capital Expenditure | -276,337.0 | -241,567.0 | -362,744.0 | -220,832.0 | -271,480.0 | -341,782.5 | -365,575.2 | -391,024.1 | -418,244.6 | -447,360.1 |
| Capital Expenditure, % | -13.76 | -11.5 | -15.99 | -9.27 | -10.34 | -12.17 | -12.17 | -12.17 | -12.17 | -12.17 |
| Tax Rate, % | 31.47 | 31.47 | 31.47 | 31.47 | 31.47 | 31.47 | 31.47 | 31.47 | 31.47 | 31.47 |
| EBITAT | 137,648.3 | 165,233.2 | 203,305.8 | 228,431.6 | 255,428.4 | 241,450.9 | 258,259.2 | 276,237.5 | 295,467.3 | 316,035.8 |
| Depreciation | ||||||||||
| Changes in Account Receivables | ||||||||||
| Changes in Inventories | ||||||||||
| Changes in Accounts Payable | ||||||||||
| Capital Expenditure | ||||||||||
| UFCF | -1,921,915.7 | -56,956.8 | -142,771.2 | -94,535.4 | 58,376.4 | -191,893.5 | -129,793.9 | -138,829.3 | -148,493.7 | -158,830.8 |
| WACC, % | 4 | 4 | 3.98 | 4 | 4.02 | 4 | 4 | 4 | 4 | 4 |
| PV UFCF | ||||||||||
| SUM PV UFCF | -685,426.9 | |||||||||
| Long Term Growth Rate, % | 3.00 | |||||||||
| Free cash flow (T + 1) | -163,596 | |||||||||
| Terminal Value | -16,370,938 | |||||||||
| Present Terminal Value | -13,456,166 | |||||||||
| Enterprise Value | -14,141,593 | |||||||||
| Net Debt | 4,251,978 | |||||||||
| Equity Value | -18,393,571 | |||||||||
| Diluted Shares Outstanding, MM | 2,788 | |||||||||
| Equity Value Per Share | -6,596.31 |
Benefits You Will Receive
- Adjustable Input Variables: Effortlessly modify key assumptions (growth %, margins, WACC) to explore various scenarios.
- Comprehensive Data: Mitsui Fudosan Co., Ltd.'s ([8801T]) financial data is pre-filled to facilitate your analysis.
- Automated DCF Calculations: The template computes Net Present Value (NPV) and intrinsic value automatically for your convenience.
- Tailored and Sophisticated: A refined Excel model designed to meet your valuation requirements.
- Designed for Analysts and Investors: Perfect for evaluating projections, confirming strategies, and optimizing efficiency.
Key Features
- Comprehensive Historical Data: Mitsui Fudosan Co., Ltd.’s financial statements and pre-filled forecasts.
- Customizable Inputs: Modify WACC, tax rates, revenue growth, and EBITDA margins as needed.
- Real-Time Results: Instantly view the intrinsic value of Mitsui Fudosan Co., Ltd. recalculating live.
- Intuitive Visuals: Dashboard charts showcase valuation outcomes and essential metrics.
- Engineered for Precision: A robust tool tailored for analysts, investors, and finance professionals.
How It Operates
- 1. Access the Template: Download and open the Excel file featuring Mitsui Fudosan Co., Ltd.’s preloaded data.
- 2. Adjust Assumptions: Modify essential inputs such as growth rates, WACC, and capital expenditures.
- 3. Instant Results: The DCF model automatically calculates the intrinsic value and NPV in real time.
- 4. Explore Scenarios: Evaluate multiple forecasts to understand various valuation outcomes.
- 5. Present with Assurance: Deliver professional valuation insights to bolster your decision-making.
Why Choose Mitsui Fudosan Co., Ltd. (8801T)?
- Time-Saving: Skip the hassle of starting from scratch – our tools are ready for immediate use.
- Enhanced Accuracy: Dependable financial data and methodologies minimize valuation errors.
- Fully Customizable: Adjust the framework to align with your specific assumptions and forecasts.
- User-Friendly: Intuitive charts and outputs simplify result interpretation.
- Preferred by Professionals: Built for industry experts who prioritize accuracy and functionality.
Who Should Utilize This Product?
- Individual Investors: Make well-informed choices regarding the purchase or sale of Mitsui Fudosan shares (8801T).
- Financial Analysts: Enhance valuation processes with comprehensive financial models at your disposal.
- Consultants: Provide clients with accurate and timely valuation insights for better decision-making.
- Business Owners: Gain insights into how major corporations like Mitsui Fudosan are valued to inform your own business strategies.
- Finance Students: Master valuation methods using real-world data and practical examples related to Mitsui Fudosan (8801T).
Contents of the Template
- Pre-Filled DCF Model: Mitsui Fudosan Co., Ltd.'s financial data preloaded for immediate application.
- WACC Calculator: Comprehensive calculations for Weighted Average Cost of Capital.
- Financial Ratios: Analyze Mitsui Fudosan’s profitability, leverage, and efficiency.
- Editable Inputs: Modify assumptions such as growth, margins, and CAPEX to suit your scenarios.
- Financial Statements: Annual and quarterly reports to facilitate in-depth analysis.
- Interactive Dashboard: Effortlessly visualize key valuation metrics and outcomes.
Disclaimer
All information, articles, and product details provided on this website are for general informational and educational purposes only. We do not claim any ownership over, nor do we intend to infringe upon, any trademarks, copyrights, logos, brand names, or other intellectual property mentioned or depicted on this site. Such intellectual property remains the property of its respective owners, and any references here are made solely for identification or informational purposes, without implying any affiliation, endorsement, or partnership.
We make no representations or warranties, express or implied, regarding the accuracy, completeness, or suitability of any content or products presented. Nothing on this website should be construed as legal, tax, investment, financial, medical, or other professional advice. In addition, no part of this site—including articles or product references—constitutes a solicitation, recommendation, endorsement, advertisement, or offer to buy or sell any securities, franchises, or other financial instruments, particularly in jurisdictions where such activity would be unlawful.
All content is of a general nature and may not address the specific circumstances of any individual or entity. It is not a substitute for professional advice or services. Any actions you take based on the information provided here are strictly at your own risk. You accept full responsibility for any decisions or outcomes arising from your use of this website and agree to release us from any liability in connection with your use of, or reliance upon, the content or products found herein.