
|
Tokyo Tatemono Co., Ltd. (8804.t) Avaliação DCF |
Totalmente Editável: Adapte-Se Às Suas Necessidades No Excel Ou Planilhas
Design Profissional: Modelos Confiáveis E Padrão Da Indústria
Pré-Construídos Para Uso Rápido E Eficiente
Compatível com MAC/PC, totalmente desbloqueado
Não É Necessária Experiência; Fácil De Seguir
Tokyo Tatemono Co., Ltd. (8804.T) Bundle
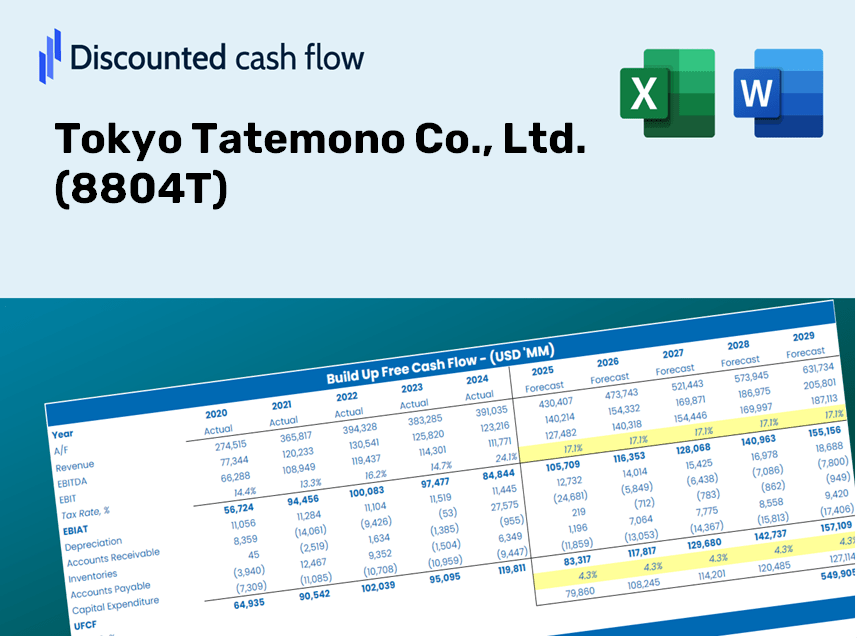
Avaliação de Tokyo Tatemono Co., Ltd. (8804T) com esta calculadora DCF personalizável! Com a Real Tokyo Tatemono Co., Ltd. (8804T) financeiras e insumos de previsão ajustáveis, você pode explorar diferentes cenários e determinar o valor justo Tokyo Tatemono Co., Ltd. (8804T) em questão de minutos.
Discounted Cash Flow (DCF) - (USD MM)
| Year | AY1 2020 |
AY2 2021 |
AY3 2022 |
AY4 2023 |
AY5 2024 |
FY1 2025 |
FY2 2026 |
FY3 2027 |
FY4 2028 |
FY5 2029 |
|---|---|---|---|---|---|---|---|---|---|---|
| Revenue | 334,980.0 | 340,477.0 | 349,940.0 | 375,946.0 | 463,724.0 | 504,532.2 | 548,931.7 | 597,238.3 | 649,795.9 | 706,978.7 |
| Revenue Growth, % | 0 | 1.64 | 2.78 | 7.43 | 23.35 | 8.8 | 8.8 | 8.8 | 8.8 | 8.8 |
| EBITDA | 69,249.0 | 77,647.0 | 83,592.0 | 91,195.0 | 102,296.0 | 114,713.1 | 124,808.0 | 135,791.2 | 147,741.0 | 160,742.4 |
| EBITDA, % | 20.67 | 22.81 | 23.89 | 24.26 | 22.06 | 22.74 | 22.74 | 22.74 | 22.74 | 22.74 |
| Depreciation | 19,616.0 | 18,862.0 | 19,113.0 | 20,686.0 | 22,625.0 | 27,485.8 | 29,904.6 | 32,536.2 | 35,399.5 | 38,514.7 |
| Depreciation, % | 5.86 | 5.54 | 5.46 | 5.5 | 4.88 | 5.45 | 5.45 | 5.45 | 5.45 | 5.45 |
| EBIT | 49,633.0 | 58,785.0 | 64,479.0 | 70,509.0 | 79,671.0 | 87,227.3 | 94,903.4 | 103,255.0 | 112,341.5 | 122,227.7 |
| EBIT, % | 14.82 | 17.27 | 18.43 | 18.76 | 17.18 | 17.29 | 17.29 | 17.29 | 17.29 | 17.29 |
| Total Cash | 54,647.0 | 87,010.0 | 82,440.0 | 127,305.0 | 111,141.0 | 124,374.1 | 135,319.1 | 147,227.3 | 160,183.5 | 174,279.9 |
| Total Cash, percent | .0 | .0 | .0 | .0 | .0 | .0 | .0 | .0 | .0 | .0 |
| Account Receivables | 13,681.0 | 13,983.0 | 14,241.0 | 13,864.0 | 15,035.0 | 19,364.5 | 21,068.6 | 22,922.7 | 24,939.9 | 27,134.6 |
| Account Receivables, % | 4.08 | 4.11 | 4.07 | 3.69 | 3.24 | 3.84 | 3.84 | 3.84 | 3.84 | 3.84 |
| Inventories | 348,571.0 | 344,219.0 | 414,914.0 | 498,998.0 | 567,927.0 | 504,532.2 | 548,931.7 | 597,238.3 | 649,795.9 | 706,978.7 |
| Inventories, % | 104.06 | 101.1 | 118.57 | 132.73 | 122.47 | 100 | 100 | 100 | 100 | 100 |
| Accounts Payable | .0 | .0 | .0 | .0 | .0 | .0 | .0 | .0 | .0 | .0 |
| Accounts Payable, % | 0 | 0 | 0 | 0 | 0 | 0 | 0 | 0 | 0 | 0 |
| Capital Expenditure | -58,184.0 | -19,386.0 | -22,495.0 | -44,796.0 | -125,152.0 | -69,015.4 | -75,088.8 | -81,696.7 | -88,886.1 | -96,708.2 |
| Capital Expenditure, % | -17.37 | -5.69 | -6.43 | -11.92 | -26.99 | -13.68 | -13.68 | -13.68 | -13.68 | -13.68 |
| Tax Rate, % | 31.7 | 31.7 | 31.7 | 31.7 | 31.7 | 31.7 | 31.7 | 31.7 | 31.7 | 31.7 |
| EBITAT | 33,631.3 | 36,551.2 | 44,248.5 | 46,466.6 | 54,418.5 | 58,052.9 | 63,161.6 | 68,719.9 | 74,767.3 | 81,347.0 |
| Depreciation | ||||||||||
| Changes in Account Receivables | ||||||||||
| Changes in Inventories | ||||||||||
| Changes in Accounts Payable | ||||||||||
| Capital Expenditure | ||||||||||
| UFCF | -367,188.7 | 40,077.2 | -30,086.5 | -61,350.4 | -118,208.5 | 75,588.6 | -28,126.1 | -30,601.3 | -33,294.2 | -36,224.1 |
| WACC, % | 3.13 | 3 | 3.15 | 3.09 | 3.14 | 3.1 | 3.1 | 3.1 | 3.1 | 3.1 |
| PV UFCF | ||||||||||
| SUM PV UFCF | -41,627.7 | |||||||||
| Long Term Growth Rate, % | 1.00 | |||||||||
| Free cash flow (T + 1) | -36,586 | |||||||||
| Terminal Value | -1,741,534 | |||||||||
| Present Terminal Value | -1,494,932 | |||||||||
| Enterprise Value | -1,536,560 | |||||||||
| Net Debt | 1,099,378 | |||||||||
| Equity Value | -2,635,938 | |||||||||
| Diluted Shares Outstanding, MM | 209 | |||||||||
| Equity Value Per Share | -12,622.89 |
What You Will Receive
- Authentic 8804T Financial Data: Pre-loaded with Tokyo Tatemono’s historical and forecasted figures for accurate evaluations.
- Completely Customizable Template: Easily adjust essential inputs like revenue growth, WACC, and EBITDA percentage.
- Instant Calculations: Watch Tokyo Tatemono's intrinsic value refresh immediately based on your input modifications.
- Expert Valuation Tool: Tailored for investors, analysts, and consultants aiming for precise DCF outcomes.
- User-Centric Design: Intuitive layout and straightforward instructions suitable for all skill levels.
Key Features
- 🔍 Real-Life 8804T Financials: Pre-filled historical and projected data for Tokyo Tatemono Co., Ltd.
- ✏️ Fully Customizable Inputs: Modify all essential parameters (yellow cells) such as WACC, growth %, and tax rates.
- 📊 Professional DCF Valuation: In-built formulas calculate the intrinsic value of Tokyo Tatemono using the Discounted Cash Flow method.
- ⚡ Instant Results: Visualize the valuation of Tokyo Tatemono immediately upon making adjustments.
- Scenario Analysis: Evaluate and compare different outcomes based on various financial assumptions side-by-side.
How It Functions
- Step 1: Download the prebuilt Excel template featuring Tokyo Tatemono Co., Ltd.’s (8804T) data.
- Step 2: Navigate through the pre-filled sheets to familiarize yourself with the essential metrics.
- Step 3: Modify forecasts and assumptions in the editable yellow cells (WACC, growth, margins).
- Step 4: Instantly observe recalculated results, including the intrinsic value of Tokyo Tatemono Co., Ltd. (8804T).
- Step 5: Utilize the outputs to make well-informed investment choices or create comprehensive reports.
Why Opt for This Calculator?
- Designed for Experts: A sophisticated tool utilized by analysts, CFOs, and consultants in the field.
- Accurate Data: Tokyo Tatemono Co., Ltd.’s historical and projected financials are preloaded for precision.
- Forecast Scenarios: Effortlessly simulate various forecasts and assumptions.
- Instant Results: Automatically computes intrinsic value, NPV, and essential metrics.
- User-Friendly: Comprehensive step-by-step guidance ensures a smooth experience.
Who Can Benefit from This Product?
- Investors: Accurately assess the fair value of Tokyo Tatemono Co., Ltd. (8804T) prior to making investment choices.
- CFOs: Utilize an advanced DCF model for comprehensive financial reporting and analysis.
- Consultants: Efficiently modify the template for client valuation reports.
- Entrepreneurs: Obtain valuable insights into financial modeling practices of major corporations.
- Educators: Employ it as an educational resource to illustrate valuation techniques.
Overview of the Template Features
- Preloaded 8804T Data: Historical and projected financial information, including revenue, EBIT, and capital expenditures.
- DCF and WACC Models: Advanced sheets designed for calculating intrinsic value and the Weighted Average Cost of Capital.
- Editable Inputs: Cells highlighted in yellow for modifying revenue growth, tax rates, and discount rates.
- Financial Statements: Detailed annual and quarterly financials for comprehensive analysis.
- Key Ratios: Metrics on profitability, leverage, and efficiency to assess performance.
- Dashboard and Charts: Visual representations of valuation results and underlying assumptions.
Disclaimer
All information, articles, and product details provided on this website are for general informational and educational purposes only. We do not claim any ownership over, nor do we intend to infringe upon, any trademarks, copyrights, logos, brand names, or other intellectual property mentioned or depicted on this site. Such intellectual property remains the property of its respective owners, and any references here are made solely for identification or informational purposes, without implying any affiliation, endorsement, or partnership.
We make no representations or warranties, express or implied, regarding the accuracy, completeness, or suitability of any content or products presented. Nothing on this website should be construed as legal, tax, investment, financial, medical, or other professional advice. In addition, no part of this site—including articles or product references—constitutes a solicitation, recommendation, endorsement, advertisement, or offer to buy or sell any securities, franchises, or other financial instruments, particularly in jurisdictions where such activity would be unlawful.
All content is of a general nature and may not address the specific circumstances of any individual or entity. It is not a substitute for professional advice or services. Any actions you take based on the information provided here are strictly at your own risk. You accept full responsibility for any decisions or outcomes arising from your use of this website and agree to release us from any liability in connection with your use of, or reliance upon, the content or products found herein.