
|
Japão Metropolitan Fund Investment Corporation (8953.T) Avaliação DCF |
Totalmente Editável: Adapte-Se Às Suas Necessidades No Excel Ou Planilhas
Design Profissional: Modelos Confiáveis E Padrão Da Indústria
Pré-Construídos Para Uso Rápido E Eficiente
Compatível com MAC/PC, totalmente desbloqueado
Não É Necessária Experiência; Fácil De Seguir
Japan Metropolitan Fund Investment Corporation (8953.T) Bundle
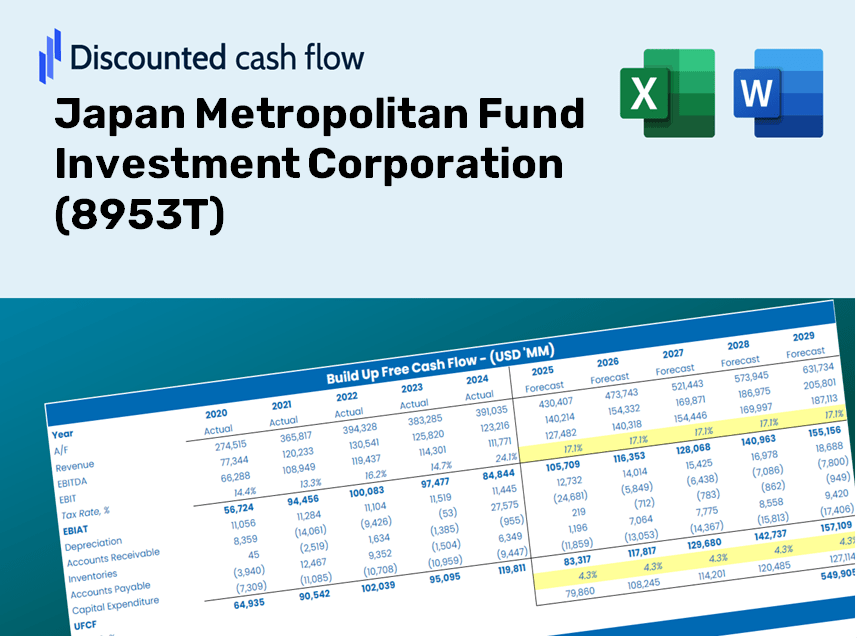
Projetado para precisão, nossa calculadora DCF (8953T) permite avaliar a avaliação da Japan Metropolitan Fund Corporation usando dados financeiros confiáveis, oferecendo flexibilidade completa para modificar todos os parâmetros -chave para projeções aprimoradas.
Discounted Cash Flow (DCF) - (USD MM)
| Year | AY1 2021 |
AY2 2022 |
AY3 2023 |
AY4 2024 |
AY5 2025 |
FY1 2026 |
FY2 2027 |
FY3 2028 |
FY4 2029 |
FY5 2030 |
|---|---|---|---|---|---|---|---|---|---|---|
| Revenue | 62,856.6 | 70,879.7 | 81,711.0 | 82,738.3 | 81,715.9 | 87,449.6 | 93,585.7 | 100,152.4 | 107,179.8 | 114,700.3 |
| Revenue Growth, % | 0 | 12.76 | 15.28 | 1.26 | -1.24 | 7.02 | 7.02 | 7.02 | 7.02 | 7.02 |
| EBITDA | 38,461.5 | 41,520.0 | 48,699.7 | 48,566.1 | 48,165.4 | 51,946.6 | 55,591.5 | 59,492.2 | 63,666.6 | 68,133.9 |
| EBITDA, % | 61.19 | 58.58 | 59.6 | 58.7 | 58.94 | 59.4 | 59.4 | 59.4 | 59.4 | 59.4 |
| Depreciation | 10,823.6 | 11,971.6 | 12,875.8 | 12,477.3 | 12,119.9 | 13,953.4 | 14,932.4 | 15,980.2 | 17,101.5 | 18,301.5 |
| Depreciation, % | 17.22 | 16.89 | 15.76 | 15.08 | 14.83 | 15.96 | 15.96 | 15.96 | 15.96 | 15.96 |
| EBIT | 27,637.9 | 29,548.4 | 35,823.8 | 36,088.9 | 36,045.5 | 37,993.2 | 40,659.1 | 43,512.0 | 46,565.1 | 49,832.5 |
| EBIT, % | 43.97 | 41.69 | 43.84 | 43.62 | 44.11 | 43.45 | 43.45 | 43.45 | 43.45 | 43.45 |
| Total Cash | 47,708.2 | 64,815.5 | 41,232.6 | 37,370.3 | 18,392.0 | 49,930.3 | 53,433.8 | 57,183.1 | 61,195.4 | 65,489.4 |
| Total Cash, percent | .0 | .0 | .0 | .0 | .0 | .0 | .0 | .0 | .0 | .0 |
| Account Receivables | 1,003.7 | 1,092.8 | 1,092.0 | 1,103.6 | 1,004.6 | 1,231.0 | 1,317.4 | 1,409.8 | 1,508.7 | 1,614.6 |
| Account Receivables, % | 1.6 | 1.54 | 1.34 | 1.33 | 1.23 | 1.41 | 1.41 | 1.41 | 1.41 | 1.41 |
| Inventories | 14,102.2 | 18,562.3 | -16.0 | .0 | .0 | 8,500.9 | 9,097.4 | 9,735.7 | 10,418.8 | 11,149.9 |
| Inventories, % | 22.44 | 26.19 | -0.01958122 | 0 | 0 | 9.72 | 9.72 | 9.72 | 9.72 | 9.72 |
| Accounts Payable | 2,362.9 | 3,828.8 | 4,686.5 | 4,863.4 | 4,419.4 | 4,579.3 | 4,900.7 | 5,244.5 | 5,612.5 | 6,006.3 |
| Accounts Payable, % | 3.76 | 5.4 | 5.74 | 5.88 | 5.41 | 5.24 | 5.24 | 5.24 | 5.24 | 5.24 |
| Capital Expenditure | -24,391.9 | -34,021.8 | -71,128.2 | -25,857.2 | -34,393.2 | -43,234.1 | -46,267.7 | -49,514.2 | -52,988.5 | -56,706.5 |
| Capital Expenditure, % | -38.81 | -48 | -87.05 | -31.25 | -42.09 | -49.44 | -49.44 | -49.44 | -49.44 | -49.44 |
| Tax Rate, % | 0.0038154 | 0.0038154 | 0.0038154 | 0.0038154 | 0.0038154 | 0.0038154 | 0.0038154 | 0.0038154 | 0.0038154 | 0.0038154 |
| EBITAT | 27,636.5 | 29,547.0 | 35,822.5 | 36,087.5 | 36,044.2 | 37,991.6 | 40,657.4 | 43,510.2 | 46,563.2 | 49,830.4 |
| Depreciation | ||||||||||
| Changes in Account Receivables | ||||||||||
| Changes in Inventories | ||||||||||
| Changes in Accounts Payable | ||||||||||
| Capital Expenditure | ||||||||||
| UFCF | 1,325.3 | 4,413.4 | -2,993.0 | 22,856.8 | 13,425.8 | 143.6 | 8,960.6 | 9,589.3 | 10,262.1 | 10,982.2 |
| WACC, % | 4.77 | 4.77 | 4.77 | 4.77 | 4.77 | 4.77 | 4.77 | 4.77 | 4.77 | 4.77 |
| PV UFCF | ||||||||||
| SUM PV UFCF | 33,860.9 | |||||||||
| Long Term Growth Rate, % | 2.00 | |||||||||
| Free cash flow (T + 1) | 11,202 | |||||||||
| Terminal Value | 405,120 | |||||||||
| Present Terminal Value | 320,997 | |||||||||
| Enterprise Value | 354,858 | |||||||||
| Net Debt | 535,253 | |||||||||
| Equity Value | -180,395 | |||||||||
| Diluted Shares Outstanding, MM | 7 | |||||||||
| Equity Value Per Share | -25,823.39 |
What You Will Receive
- Customizable Excel Template: A fully adaptable Excel-based DCF Calculator featuring pre-loaded financial data for Japan Metropolitan Fund Investment Corporation (8953T).
- Accurate Market Data: Access to historical performance data and forward-looking forecasts (highlighted in the yellow cells).
- Flexible Forecasting: Adjust forecast parameters such as revenue growth, EBITDA %, and WACC to suit your analysis.
- Instant Calculations: Quickly observe how your input adjustments affect the valuation of Japan Metropolitan Fund Investment Corporation (8953T).
- Professional-grade Tool: Designed for investors, CFOs, consultants, and financial analysts in the industry.
- User-Centric Layout: Organized for straightforward navigation, accompanied by comprehensive step-by-step guidance.
Key Features
- Real Japan Metropolitan Fund Financials: Gain access to reliable pre-loaded historical data and future projections for (8953T).
- Customizable Investment Assumptions: Modify highlighted fields such as WACC, growth rates, and margins to fit your analysis.
- Dynamic Financial Calculations: Instant updates for DCF, Net Present Value (NPV), and cash flow assessments.
- Visual Analytics Dashboard: Clear and concise charts and summaries to effectively present your valuation outcomes.
- Designed for All Expertise Levels: A user-friendly layout suited for investors, CFOs, and financial consultants.
How It Works
- 1. Download the Template: Obtain and open the Excel file containing Japan Metropolitan Fund Investment Corporation’s (8953T) preloaded data.
- 2. Adjust Assumptions: Update key parameters such as growth rates, WACC, and capital expenditures as needed.
- 3. See Results in Real-Time: The DCF model automatically calculates the intrinsic value and NPV based on your inputs.
- 4. Explore Different Scenarios: Evaluate various forecasts to understand how different assumptions affect the valuation.
- 5. Present with Assurance: Share professional valuation insights to back your investment decisions.
Why Select This Calculator for Japan Metropolitan Fund Investment Corporation (8953T)?
- All-in-One Tool: Offers DCF, WACC, and detailed financial ratio analyses seamlessly integrated.
- Flexible Input Options: Modify the yellow-highlighted fields to explore different financial scenarios.
- In-Depth Analysis: Automatically computes the intrinsic value and Net Present Value for Japan Metropolitan Fund Investment Corporation (8953T).
- Data Ready for Use: Comes with preloaded historical and projected data for reliable analysis.
- High-Quality Standards: Perfect for financial analysts, investors, and business consultants focused on Japan Metropolitan Fund Investment Corporation (8953T).
Who Can Benefit from This Product?
- Finance Students: Master valuation techniques and practice with real-world data.
- Academics: Enrich your courses or research by utilizing industry-standard models.
- Investors: Validate your assumptions and scrutinize valuation results for Japan Metropolitan Fund Investment Corporation (8953T).
- Analysts: Enhance your efficiency with a ready-to-use, customizable DCF model.
- Small Business Owners: Learn how major public companies like Japan Metropolitan Fund Investment Corporation (8953T) are evaluated.
Overview of Template Features
- Operating and Balance Sheet Data: Pre-filled historical data and forecasts for Japan Metropolitan Fund Investment Corporation (8953T), including revenue, EBITDA, EBIT, and capital expenditures.
- WACC Calculation: A dedicated sheet for the Weighted Average Cost of Capital (WACC), featuring key parameters such as Beta, risk-free rate, and share price.
- DCF Valuation (Unlevered and Levered): Customizable Discounted Cash Flow models that illustrate intrinsic value with comprehensive calculations.
- Financial Statements: Pre-loaded financial statements (annual and quarterly) to facilitate thorough analysis.
- Key Ratios: Includes profitability, leverage, and efficiency ratios specific to Japan Metropolitan Fund Investment Corporation (8953T).
- Dashboard and Charts: A visual summary of valuation outputs and assumptions for easy result analysis.
Disclaimer
All information, articles, and product details provided on this website are for general informational and educational purposes only. We do not claim any ownership over, nor do we intend to infringe upon, any trademarks, copyrights, logos, brand names, or other intellectual property mentioned or depicted on this site. Such intellectual property remains the property of its respective owners, and any references here are made solely for identification or informational purposes, without implying any affiliation, endorsement, or partnership.
We make no representations or warranties, express or implied, regarding the accuracy, completeness, or suitability of any content or products presented. Nothing on this website should be construed as legal, tax, investment, financial, medical, or other professional advice. In addition, no part of this site—including articles or product references—constitutes a solicitation, recommendation, endorsement, advertisement, or offer to buy or sell any securities, franchises, or other financial instruments, particularly in jurisdictions where such activity would be unlawful.
All content is of a general nature and may not address the specific circumstances of any individual or entity. It is not a substitute for professional advice or services. Any actions you take based on the information provided here are strictly at your own risk. You accept full responsibility for any decisions or outcomes arising from your use of this website and agree to release us from any liability in connection with your use of, or reliance upon, the content or products found herein.