
|
Tobu Railway Co., Ltd. (9001.T) Avaliação DCF |
Totalmente Editável: Adapte-Se Às Suas Necessidades No Excel Ou Planilhas
Design Profissional: Modelos Confiáveis E Padrão Da Indústria
Pré-Construídos Para Uso Rápido E Eficiente
Compatível com MAC/PC, totalmente desbloqueado
Não É Necessária Experiência; Fácil De Seguir
Tobu Railway Co., Ltd. (9001.T) Bundle
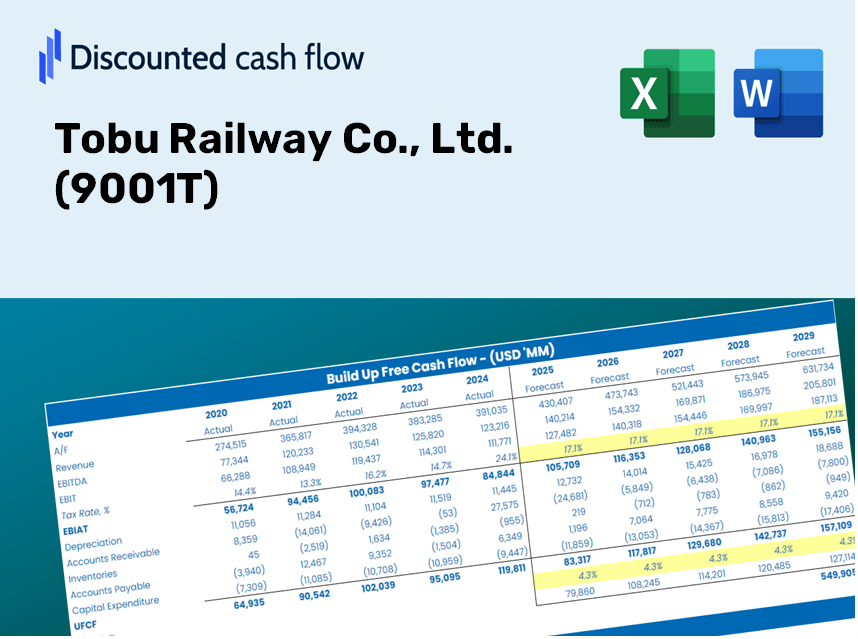
Projetado para precisão, nossa calculadora DCF (9001T) o capacita a avaliar a avaliação da Tobu Railway Co., Ltd. usando dados financeiros do mundo real, oferecendo flexibilidade completa para modificar todos os parâmetros essenciais para projeções aprimoradas.
Discounted Cash Flow (DCF) - (USD MM)
| Year | AY1 2020 |
AY2 2021 |
AY3 2022 |
AY4 2023 |
AY5 2024 |
FY1 2025 |
FY2 2026 |
FY3 2027 |
FY4 2028 |
FY5 2029 |
|---|---|---|---|---|---|---|---|---|---|---|
| Revenue | 496,326.0 | 506,023.0 | 614,751.0 | 635,964.0 | 631,461.0 | 672,795.1 | 716,834.8 | 763,757.2 | 813,751.1 | 867,017.5 |
| Revenue Growth, % | 0 | 1.95 | 21.49 | 3.45 | -0.70806 | 6.55 | 6.55 | 6.55 | 6.55 | 6.55 |
| EBITDA | 41,606.0 | 85,679.0 | 104,552.0 | 126,795.0 | 135,721.0 | 112,696.5 | 120,073.4 | 127,933.1 | 136,307.3 | 145,229.7 |
| EBITDA, % | 8.38 | 16.93 | 17.01 | 19.94 | 21.49 | 16.75 | 16.75 | 16.75 | 16.75 | 16.75 |
| Depreciation | 57,583.0 | 55,955.0 | 53,739.0 | 53,302.0 | 53,555.0 | 64,943.1 | 69,194.1 | 73,723.4 | 78,549.2 | 83,690.9 |
| Depreciation, % | 11.6 | 11.06 | 8.74 | 8.38 | 8.48 | 9.65 | 9.65 | 9.65 | 9.65 | 9.65 |
| EBIT | -15,977.0 | 29,724.0 | 50,813.0 | 73,493.0 | 82,166.0 | 47,753.4 | 50,879.2 | 54,209.7 | 57,758.1 | 61,538.8 |
| EBIT, % | -3.22 | 5.87 | 8.27 | 11.56 | 13.01 | 7.1 | 7.1 | 7.1 | 7.1 | 7.1 |
| Total Cash | 45,134.0 | 46,066.0 | 69,255.0 | 31,448.0 | 35,110.0 | 53,780.2 | 57,300.5 | 61,051.3 | 65,047.6 | 69,305.5 |
| Total Cash, percent | .0 | .0 | .0 | .0 | .0 | .0 | .0 | .0 | .0 | .0 |
| Account Receivables | 52,216.0 | 74,446.0 | 86,377.0 | 76,798.0 | 76,752.0 | 85,463.4 | 91,057.7 | 97,018.1 | 103,368.7 | 110,135.0 |
| Account Receivables, % | 10.52 | 14.71 | 14.05 | 12.08 | 12.15 | 12.7 | 12.7 | 12.7 | 12.7 | 12.7 |
| Inventories | 23,428.0 | 19,517.0 | 19,235.0 | 24,238.0 | 30,621.0 | 27,405.1 | 29,199.0 | 31,110.3 | 33,146.7 | 35,316.4 |
| Inventories, % | 4.72 | 3.86 | 3.13 | 3.81 | 4.85 | 4.07 | 4.07 | 4.07 | 4.07 | 4.07 |
| Accounts Payable | 36,261.0 | 42,769.0 | 51,922.0 | 48,653.0 | 43,274.0 | 52,084.0 | 55,493.3 | 59,125.8 | 62,996.0 | 67,119.6 |
| Accounts Payable, % | 7.31 | 8.45 | 8.45 | 7.65 | 6.85 | 7.74 | 7.74 | 7.74 | 7.74 | 7.74 |
| Capital Expenditure | -80,653.0 | -53,984.0 | -57,262.0 | -82,934.0 | -110,881.0 | -89,929.9 | -95,816.5 | -102,088.5 | -108,771.0 | -115,890.9 |
| Capital Expenditure, % | -16.25 | -10.67 | -9.31 | -13.04 | -17.56 | -13.37 | -13.37 | -13.37 | -13.37 | -13.37 |
| Tax Rate, % | 32.78 | 32.78 | 32.78 | 32.78 | 32.78 | 32.78 | 32.78 | 32.78 | 32.78 | 32.78 |
| EBITAT | -17,903.2 | 16,731.3 | 32,832.3 | 52,171.3 | 55,235.6 | 34,297.9 | 36,543.0 | 38,935.0 | 41,483.6 | 44,199.1 |
| Depreciation | ||||||||||
| Changes in Account Receivables | ||||||||||
| Changes in Inventories | ||||||||||
| Changes in Accounts Payable | ||||||||||
| Capital Expenditure | ||||||||||
| UFCF | -80,356.2 | 6,891.3 | 26,813.3 | 23,846.3 | -13,806.4 | 12,625.6 | 5,941.8 | 6,330.7 | 6,745.1 | 7,186.6 |
| WACC, % | 4.59 | 3.65 | 3.83 | 3.96 | 3.88 | 3.98 | 3.98 | 3.98 | 3.98 | 3.98 |
| PV UFCF | ||||||||||
| SUM PV UFCF | 34,950.8 | |||||||||
| Long Term Growth Rate, % | 2.00 | |||||||||
| Free cash flow (T + 1) | 7,330 | |||||||||
| Terminal Value | 370,005 | |||||||||
| Present Terminal Value | 304,393 | |||||||||
| Enterprise Value | 339,344 | |||||||||
| Net Debt | 743,944 | |||||||||
| Equity Value | -404,600 | |||||||||
| Diluted Shares Outstanding, MM | 203 | |||||||||
| Equity Value Per Share | -1,994.12 |
What You Will Receive
- Pre-Filled Financial Model: Tobu Railway’s actual data allows for accurate DCF valuation.
- Complete Forecast Control: Modify revenue growth, profit margins, WACC, and other essential drivers.
- Immediate Calculations: Automatic updates guarantee you see outcomes as you adjust parameters.
- Investor-Ready Template: A polished Excel file crafted for professional-level valuation.
- Customizable and Reusable: Designed for adaptability, enabling repeated use for comprehensive forecasts.
Key Features
- Pre-Loaded Data: Historical financial statements and pre-filled forecasts for Tobu Railway Co., Ltd. (9001T).
- Fully Adjustable Inputs: Customize WACC, tax rates, revenue growth, and EBITDA margins as needed.
- Instant Results: Watch the intrinsic value of Tobu Railway Co., Ltd. (9001T) update in real time.
- Clear Visual Outputs: Dashboard charts provide visual representations of valuation results and key metrics.
- Built for Accuracy: A reliable tool designed for analysts, investors, and finance professionals.
How It Functions
- Step 1: Download the Excel file.
- Step 2: Examine the pre-filled data for Tobu Railway (9001T) (historical and projected).
- Step 3: Modify key assumptions (highlighted in yellow) according to your analysis.
- Step 4: Observe the automatic updates for Tobu Railway’s intrinsic value.
- Step 5: Utilize the results for investment strategies or reporting purposes.
Why Opt for the Tobu Railway Co., Ltd. (9001T) Calculator?
- Precision: Utilize authentic Tobu Railway financial data for impeccable accuracy.
- Adaptability: Tailored for users to easily adjust and experiment with inputs.
- Efficiency: Eliminate the need to create a financial model from the ground up.
- High-Quality Standards: Built with the expertise and usability expected at the CFO level.
- Intuitive Design: Simple interface suitable for users with varying levels of financial modeling proficiency.
Who Should Benefit from This Product?
- Professional Investors: Develop comprehensive and dependable valuation models for portfolio assessments focused on Tobu Railway Co., Ltd. (9001T).
- Corporate Finance Departments: Evaluate valuation scenarios to inform strategic decisions within the organization.
- Consultants and Advisors: Deliver precise valuation insights regarding Tobu Railway Co., Ltd. (9001T) to clients.
- Students and Educators: Utilize real-world data to enhance learning and practice in financial modeling.
- Transport Industry Enthusiasts: Gain insight into how transportation companies like Tobu Railway Co., Ltd. (9001T) are valued in the market.
Contents of the Template
- Pre-Filled DCF Model: Tobu Railway's financial data preloaded for immediate application.
- WACC Calculator: Comprehensive calculations for Weighted Average Cost of Capital.
- Financial Ratios: Assess Tobu Railway's profitability, leverage, and operational efficiency.
- Editable Inputs: Adjust assumptions such as growth rates, margins, and capital expenditures to suit your analysis.
- Financial Statements: Annual and quarterly reports for in-depth examination.
- Interactive Dashboard: Effortlessly visualize essential valuation metrics and outcomes.
Disclaimer
All information, articles, and product details provided on this website are for general informational and educational purposes only. We do not claim any ownership over, nor do we intend to infringe upon, any trademarks, copyrights, logos, brand names, or other intellectual property mentioned or depicted on this site. Such intellectual property remains the property of its respective owners, and any references here are made solely for identification or informational purposes, without implying any affiliation, endorsement, or partnership.
We make no representations or warranties, express or implied, regarding the accuracy, completeness, or suitability of any content or products presented. Nothing on this website should be construed as legal, tax, investment, financial, medical, or other professional advice. In addition, no part of this site—including articles or product references—constitutes a solicitation, recommendation, endorsement, advertisement, or offer to buy or sell any securities, franchises, or other financial instruments, particularly in jurisdictions where such activity would be unlawful.
All content is of a general nature and may not address the specific circumstances of any individual or entity. It is not a substitute for professional advice or services. Any actions you take based on the information provided here are strictly at your own risk. You accept full responsibility for any decisions or outcomes arising from your use of this website and agree to release us from any liability in connection with your use of, or reliance upon, the content or products found herein.