
|
Keio Corporation (9008.T) Avaliação DCF |
Totalmente Editável: Adapte-Se Às Suas Necessidades No Excel Ou Planilhas
Design Profissional: Modelos Confiáveis E Padrão Da Indústria
Pré-Construídos Para Uso Rápido E Eficiente
Compatível com MAC/PC, totalmente desbloqueado
Não É Necessária Experiência; Fácil De Seguir
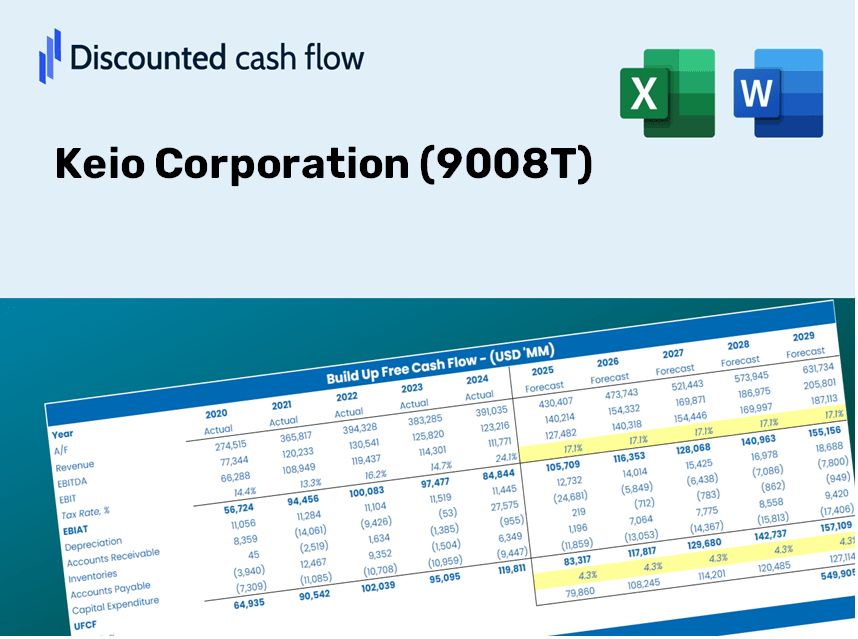
Keio Corporation (9008.T) Bundle
Explore o potencial financeiro da Keio Corporation (9008T) com nossa calculadora DCF amigável! Basta inserir suas suposições sobre crescimento, margens e custos para determinar o valor intrínseco da Keio Corporation (9008T) e informar suas decisões de investimento.
Discounted Cash Flow (DCF) - (USD MM)
| Year | AY1 2021 |
AY2 2022 |
AY3 2023 |
AY4 2024 |
AY5 2025 |
FY1 2026 |
FY2 2027 |
FY3 2028 |
FY4 2029 |
FY5 2030 |
|---|---|---|---|---|---|---|---|---|---|---|
| Revenue | 315,439.0 | 299,872.0 | 347,133.0 | 408,694.0 | 452,916.0 | 455,636.1 | 458,372.5 | 461,125.4 | 463,894.8 | 466,680.8 |
| Revenue Growth, % | 0 | -4.94 | 15.76 | 17.73 | 10.82 | 0.60057 | 0.60057 | 0.60057 | 0.60057 | 0.60057 |
| EBITDA | 17,156.0 | 48,633.0 | 53,046.0 | 75,500.0 | 89,309.0 | 68,463.9 | 68,875.1 | 69,288.7 | 69,704.8 | 70,123.5 |
| EBITDA, % | 5.44 | 16.22 | 15.28 | 18.47 | 19.72 | 15.03 | 15.03 | 15.03 | 15.03 | 15.03 |
| Depreciation | 35,135.0 | 31,467.0 | 29,127.0 | 30,851.0 | 32,809.0 | 40,838.9 | 41,084.2 | 41,330.9 | 41,579.2 | 41,828.9 |
| Depreciation, % | 11.14 | 10.49 | 8.39 | 7.55 | 7.24 | 8.96 | 8.96 | 8.96 | 8.96 | 8.96 |
| EBIT | -17,979.0 | 17,166.0 | 23,919.0 | 44,649.0 | 56,500.0 | 27,625.0 | 27,790.9 | 27,957.8 | 28,125.7 | 28,294.6 |
| EBIT, % | -5.7 | 5.72 | 6.89 | 10.92 | 12.47 | 6.06 | 6.06 | 6.06 | 6.06 | 6.06 |
| Total Cash | 76,772.0 | 67,403.0 | 71,030.0 | 73,064.0 | 48,254.0 | 87,307.9 | 87,832.2 | 88,359.7 | 88,890.4 | 89,424.3 |
| Total Cash, percent | .0 | .0 | .0 | .0 | .0 | .0 | .0 | .0 | .0 | .0 |
| Account Receivables | 37,996.0 | 40,883.0 | 45,285.0 | 59,632.0 | 65,770.0 | 61,817.7 | 62,188.9 | 62,562.4 | 62,938.2 | 63,316.1 |
| Account Receivables, % | 12.05 | 13.63 | 13.05 | 14.59 | 14.52 | 13.57 | 13.57 | 13.57 | 13.57 | 13.57 |
| Inventories | 35,641.0 | 41,506.0 | 60,218.0 | 107,630.0 | 142,634.0 | 91,414.1 | 91,963.1 | 92,515.4 | 93,071.0 | 93,630.0 |
| Inventories, % | 11.3 | 13.84 | 17.35 | 26.34 | 31.49 | 20.06 | 20.06 | 20.06 | 20.06 | 20.06 |
| Accounts Payable | 16,043.0 | 16,067.0 | 18,633.0 | 24,413.0 | 25,831.0 | 25,049.3 | 25,199.7 | 25,351.1 | 25,503.3 | 25,656.5 |
| Accounts Payable, % | 5.09 | 5.36 | 5.37 | 5.97 | 5.7 | 5.5 | 5.5 | 5.5 | 5.5 | 5.5 |
| Capital Expenditure | -46,169.0 | -36,986.0 | -56,089.0 | -44,296.0 | -48,877.0 | -59,012.3 | -59,366.8 | -59,723.3 | -60,082.0 | -60,442.8 |
| Capital Expenditure, % | -14.64 | -12.33 | -16.16 | -10.84 | -10.79 | -12.95 | -12.95 | -12.95 | -12.95 | -12.95 |
| Tax Rate, % | 19.95 | 19.95 | 19.95 | 19.95 | 19.95 | 19.95 | 19.95 | 19.95 | 19.95 | 19.95 |
| EBITAT | -23,485.3 | 6,693.1 | 14,931.2 | 31,547.1 | 45,227.4 | 19,454.5 | 19,571.4 | 19,688.9 | 19,807.2 | 19,926.1 |
| Depreciation | ||||||||||
| Changes in Account Receivables | ||||||||||
| Changes in Inventories | ||||||||||
| Changes in Accounts Payable | ||||||||||
| Capital Expenditure | ||||||||||
| UFCF | -92,113.3 | -7,553.9 | -32,578.8 | -37,876.9 | -10,564.6 | 55,671.6 | 519.0 | 522.1 | 525.2 | 528.4 |
| WACC, % | 4.18 | 3.09 | 3.51 | 3.66 | 3.83 | 3.65 | 3.65 | 3.65 | 3.65 | 3.65 |
| PV UFCF | ||||||||||
| SUM PV UFCF | 55,557.4 | |||||||||
| Long Term Growth Rate, % | 2.00 | |||||||||
| Free cash flow (T + 1) | 539 | |||||||||
| Terminal Value | 32,582 | |||||||||
| Present Terminal Value | 27,230 | |||||||||
| Enterprise Value | 82,787 | |||||||||
| Net Debt | 398,681 | |||||||||
| Equity Value | -315,894 | |||||||||
| Diluted Shares Outstanding, MM | 121 | |||||||||
| Equity Value Per Share | -2,607.35 |
What You Will Receive
- Adjustable Forecast Inputs: Effortlessly modify key assumptions (growth %, margins, WACC) to explore various scenarios.
- Real-World Data: Keio Corporation’s (9008T) financial information provided to facilitate your analysis.
- Automated DCF Outputs: The template computes Net Present Value (NPV) and intrinsic value automatically.
- Tailorable and Professional: A refined Excel model designed to meet your valuation requirements.
- Designed for Analysts and Investors: Perfect for examining projections, verifying strategies, and optimizing your time.
Key Features
- Comprehensive DCF Calculator: Features detailed unlevered and levered DCF valuation models tailored for Keio Corporation (9008T).
- WACC Calculator: Ready-to-use Weighted Average Cost of Capital template with adjustable parameters.
- Customizable Forecast Assumptions: Easily adjust growth rates, capital expenditures, and discount rates.
- Integrated Financial Ratios: Evaluate profitability, leverage, and efficiency ratios specific to Keio Corporation (9008T).
- Interactive Dashboard and Charts: Visual representations highlight essential valuation metrics for straightforward analysis.
How It Works
- Step 1: Download the prebuilt Excel template that includes data for Keio Corporation (9008T).
- Step 2: Navigate through the pre-filled sheets to familiarize yourself with the key metrics.
- Step 3: Modify forecasts and assumptions in the editable yellow cells (WACC, growth, margins).
- Step 4: Immediately see recalculated results, including Keio Corporation's intrinsic value.
- Step 5: Use the outputs to make informed investment decisions or to create reports.
Why Opt for This Calculator?
- All-in-One Solution: Features DCF, WACC, and in-depth financial ratio analysis in a single tool.
- Flexible Inputs: Modify the highlighted cells to explore different financial scenarios.
- Comprehensive Analysis: Automatically computes Keio Corporation’s intrinsic value and Net Present Value.
- Preloaded Information: Access to historical and projected data for precise calculations.
- Expert-Level Quality: Perfect for financial analysts, investors, and business advisors.
Who Can Benefit from Keio Corporation's (9008T) Product?
- Investors: Gain assurance in your decisions with a reliable, professional-grade valuation tool.
- Financial Analysts: Streamline your workflow with a customizable pre-built DCF model.
- Consultants: Effortlessly modify the template for impactful client presentations or reports.
- Finance Enthusiasts: Enhance your knowledge of valuation techniques through practical, real-world examples.
- Educators and Students: Utilize it as an effective learning resource in finance courses.
Contents of the Template
- Pre-Filled DCF Model: Keio Corporation’s financial data preloaded for immediate analysis.
- WACC Calculator: Comprehensive calculations for Weighted Average Cost of Capital.
- Financial Ratios: Assess Keio Corporation’s profitability, leverage, and operational efficiency.
- Editable Inputs: Adjust assumptions such as growth rates, profit margins, and capital expenditures to suit your model.
- Financial Statements: Access annual and quarterly reports for in-depth examination.
- Interactive Dashboard: Effortlessly visualize essential valuation metrics and findings.
Disclaimer
All information, articles, and product details provided on this website are for general informational and educational purposes only. We do not claim any ownership over, nor do we intend to infringe upon, any trademarks, copyrights, logos, brand names, or other intellectual property mentioned or depicted on this site. Such intellectual property remains the property of its respective owners, and any references here are made solely for identification or informational purposes, without implying any affiliation, endorsement, or partnership.
We make no representations or warranties, express or implied, regarding the accuracy, completeness, or suitability of any content or products presented. Nothing on this website should be construed as legal, tax, investment, financial, medical, or other professional advice. In addition, no part of this site—including articles or product references—constitutes a solicitation, recommendation, endorsement, advertisement, or offer to buy or sell any securities, franchises, or other financial instruments, particularly in jurisdictions where such activity would be unlawful.
All content is of a general nature and may not address the specific circumstances of any individual or entity. It is not a substitute for professional advice or services. Any actions you take based on the information provided here are strictly at your own risk. You accept full responsibility for any decisions or outcomes arising from your use of this website and agree to release us from any liability in connection with your use of, or reliance upon, the content or products found herein.