
|
Keihan Holdings Co., Ltd. (9045.T) Avaliação DCF |
Totalmente Editável: Adapte-Se Às Suas Necessidades No Excel Ou Planilhas
Design Profissional: Modelos Confiáveis E Padrão Da Indústria
Pré-Construídos Para Uso Rápido E Eficiente
Compatível com MAC/PC, totalmente desbloqueado
Não É Necessária Experiência; Fácil De Seguir
Keihan Holdings Co., Ltd. (9045.T) Bundle
Avalie as perspectivas financeiras da Keihan Holdings Co., Ltd. (9045T) como um especialista! Esta calculadora DCF (9045T) fornece dados financeiros pré-preenchidos, juntamente com a flexibilidade para modificar o crescimento da receita, o WACC, as margens e outras suposições críticas para se alinhar às suas previsões.
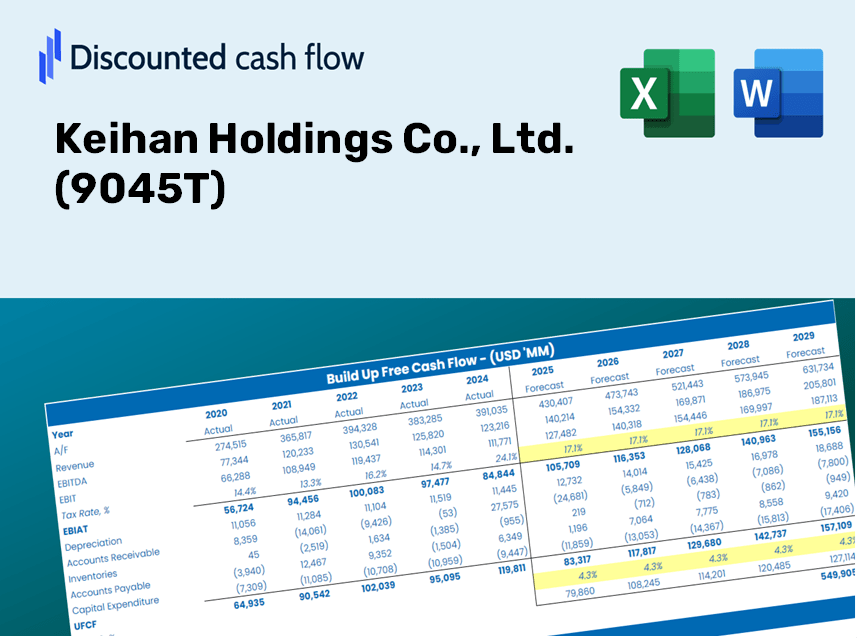
Discounted Cash Flow (DCF) - (USD MM)
| Year | AY1 2020 |
AY2 2021 |
AY3 2022 |
AY4 2023 |
AY5 2024 |
FY1 2025 |
FY2 2026 |
FY3 2027 |
FY4 2028 |
FY5 2029 |
|---|---|---|---|---|---|---|---|---|---|---|
| Revenue | 253,419.0 | 258,118.0 | 260,070.0 | 302,147.0 | 313,546.0 | 322,954.6 | 332,645.5 | 342,627.2 | 352,908.4 | 363,498.1 |
| Revenue Growth, % | 0 | 1.85 | 0.75624 | 16.18 | 3.77 | 3 | 3 | 3 | 3 | 3 |
| EBITDA | 24,393.0 | 41,078.0 | 40,716.0 | 56,993.0 | 65,713.0 | 52,329.3 | 53,899.5 | 55,516.9 | 57,182.8 | 58,898.7 |
| EBITDA, % | 9.63 | 15.91 | 15.66 | 18.86 | 20.96 | 16.2 | 16.2 | 16.2 | 16.2 | 16.2 |
| Depreciation | 21,333.0 | 21,071.0 | 20,223.0 | 20,171.0 | 22,738.0 | 24,728.7 | 25,470.8 | 26,235.1 | 27,022.3 | 27,833.2 |
| Depreciation, % | 8.42 | 8.16 | 7.78 | 6.68 | 7.25 | 7.66 | 7.66 | 7.66 | 7.66 | 7.66 |
| EBIT | 3,060.0 | 20,007.0 | 20,493.0 | 36,822.0 | 42,975.0 | 27,600.5 | 28,428.7 | 29,281.8 | 30,160.5 | 31,065.5 |
| EBIT, % | 1.21 | 7.75 | 7.88 | 12.19 | 13.71 | 8.55 | 8.55 | 8.55 | 8.55 | 8.55 |
| Total Cash | 27,345.0 | 21,759.0 | 16,859.0 | 23,005.0 | 15,800.0 | 24,774.3 | 25,517.7 | 26,283.4 | 27,072.1 | 27,884.5 |
| Total Cash, percent | .0 | .0 | .0 | .0 | .0 | .0 | .0 | .0 | .0 | .0 |
| Account Receivables | 23,184.0 | 24,834.0 | 35,673.0 | 46,999.0 | 34,920.0 | 38,223.9 | 39,370.9 | 40,552.3 | 41,769.2 | 43,022.5 |
| Account Receivables, % | 9.15 | 9.62 | 13.72 | 15.56 | 11.14 | 11.84 | 11.84 | 11.84 | 11.84 | 11.84 |
| Inventories | 1,590.0 | 1,430.0 | 1,538.0 | 154,022.0 | 163,099.0 | 67,669.5 | 69,700.0 | 71,791.5 | 73,945.8 | 76,164.6 |
| Inventories, % | 0.62742 | 0.55401 | 0.59138 | 50.98 | 52.02 | 20.95 | 20.95 | 20.95 | 20.95 | 20.95 |
| Accounts Payable | 9,639.0 | 10,020.0 | 10,137.0 | 11,032.0 | 10,064.0 | 11,913.3 | 12,270.8 | 12,639.0 | 13,018.3 | 13,408.9 |
| Accounts Payable, % | 3.8 | 3.88 | 3.9 | 3.65 | 3.21 | 3.69 | 3.69 | 3.69 | 3.69 | 3.69 |
| Capital Expenditure | -28,512.0 | -21,438.0 | -19,864.0 | -32,895.0 | -61,459.0 | -37,257.8 | -38,375.8 | -39,527.3 | -40,713.4 | -41,935.1 |
| Capital Expenditure, % | -11.25 | -8.31 | -7.64 | -10.89 | -19.6 | -11.54 | -11.54 | -11.54 | -11.54 | -11.54 |
| Tax Rate, % | 30.59 | 30.59 | 30.59 | 30.59 | 30.59 | 30.59 | 30.59 | 30.59 | 30.59 | 30.59 |
| EBITAT | -14,325.9 | 10,658.2 | 13,634.4 | 26,159.5 | 29,830.9 | 14,366.7 | 14,797.8 | 15,241.9 | 15,699.2 | 16,170.3 |
| Depreciation | ||||||||||
| Changes in Account Receivables | ||||||||||
| Changes in Inventories | ||||||||||
| Changes in Accounts Payable | ||||||||||
| Capital Expenditure | ||||||||||
| UFCF | -36,639.9 | 9,182.2 | 3,163.4 | -149,479.5 | -6,856.1 | 95,812.6 | -927.2 | -955.1 | -983.7 | -1,013.2 |
| WACC, % | 2.2 | 3.19 | 3.44 | 3.53 | 3.49 | 3.17 | 3.17 | 3.17 | 3.17 | 3.17 |
| PV UFCF | ||||||||||
| SUM PV UFCF | 89,392.3 | |||||||||
| Long Term Growth Rate, % | 2.90 | |||||||||
| Free cash flow (T + 1) | -1,043 | |||||||||
| Terminal Value | -385,573 | |||||||||
| Present Terminal Value | -329,860 | |||||||||
| Enterprise Value | -240,468 | |||||||||
| Net Debt | 367,699 | |||||||||
| Equity Value | -608,167 | |||||||||
| Diluted Shares Outstanding, MM | 105 | |||||||||
| Equity Value Per Share | -5,771.73 |
Benefits of Using Our Model
- Adjustable Forecast Parameters: Effortlessly modify assumptions (growth %, profit margins, WACC) to explore various scenarios.
- Real-Time Financial Data: Keihan Holdings Co., Ltd. (9045T) financial metrics pre-filled to enhance your analysis.
- Automated DCF Calculations: The template computes Net Present Value (NPV) and intrinsic value automatically.
- Customizable and Professional Design: A refined Excel model tailored to meet your valuation requirements.
- Designed for Analysts and Investors: Perfect for testing forecasts, confirming strategies, and saving valuable time.
Key Features
- Advanced DCF Calculator: Features comprehensive unlevered and levered DCF valuation models tailored for Keihan Holdings Co., Ltd. (9045T).
- WACC Calculator: Includes a pre-configured Weighted Average Cost of Capital sheet with adjustable parameters.
- Editable Forecast Assumptions: Customize growth rates, capital expenditures, and discount rates to fit your analysis needs.
- Built-In Financial Ratios: Evaluate the profitability, leverage, and efficiency ratios specific to Keihan Holdings Co., Ltd. (9045T).
- Dashboard and Charts: Visual representations provide a clear overview of essential valuation metrics for streamlined analysis.
How It Works
- Step 1: Download the prebuilt Excel template featuring Keihan Holdings Co., Ltd.'s data.
- Step 2: Navigate through the pre-filled sheets to familiarize yourself with the key metrics.
- Step 3: Modify forecasts and assumptions in the editable yellow cells (WACC, growth, margins).
- Step 4: Instantly view updated results, including the intrinsic value of Keihan Holdings Co., Ltd. (9045T).
- Step 5: Utilize the outputs to make informed investment decisions or create reports.
Why Choose This Calculator for Keihan Holdings Co., Ltd. (9045T)?
- User-Friendly Interface: Tailored for both newcomers and seasoned professionals.
- Customizable Inputs: Adjust assumptions effortlessly to suit your financial analysis.
- Real-Time Updates: Instantly observe how changes impact the valuation of Keihan Holdings.
- Pre-Configured: Comes equipped with Keihan's latest financial metrics for immediate assessment.
- Relied Upon by Experts: A valuable tool for investors and analysts making strategic choices.
Who Should Consider Using This Product?
- Investors: Accurately assess the fair value of Keihan Holdings Co., Ltd. (9045T) prior to making investment choices.
- CFOs: Utilize a professional-grade DCF model for financial reporting and analysis specific to your organization.
- Consultants: Quickly customize the template for valuation reports tailored to your clients’ needs.
- Entrepreneurs: Acquire insights into the financial modeling practices employed by leading companies.
- Educators: Employ it as a teaching resource to illustrate various valuation methodologies.
Contents of the Template
- Historical Data: Contains Keihan Holdings Co., Ltd.'s past financial information and baseline forecasts.
- DCF and Levered DCF Models: Comprehensive templates for estimating the intrinsic value of Keihan Holdings Co., Ltd. (9045T).
- WACC Sheet: Pre-calculated metrics for the Weighted Average Cost of Capital.
- Editable Inputs: Adjust essential parameters such as growth rates, EBITDA percentages, and CAPEX assumptions.
- Quarterly and Annual Statements: A thorough analysis of Keihan Holdings Co., Ltd.'s financial performance.
- Interactive Dashboard: Dynamically visualize valuation results and financial projections.
Disclaimer
All information, articles, and product details provided on this website are for general informational and educational purposes only. We do not claim any ownership over, nor do we intend to infringe upon, any trademarks, copyrights, logos, brand names, or other intellectual property mentioned or depicted on this site. Such intellectual property remains the property of its respective owners, and any references here are made solely for identification or informational purposes, without implying any affiliation, endorsement, or partnership.
We make no representations or warranties, express or implied, regarding the accuracy, completeness, or suitability of any content or products presented. Nothing on this website should be construed as legal, tax, investment, financial, medical, or other professional advice. In addition, no part of this site—including articles or product references—constitutes a solicitation, recommendation, endorsement, advertisement, or offer to buy or sell any securities, franchises, or other financial instruments, particularly in jurisdictions where such activity would be unlawful.
All content is of a general nature and may not address the specific circumstances of any individual or entity. It is not a substitute for professional advice or services. Any actions you take based on the information provided here are strictly at your own risk. You accept full responsibility for any decisions or outcomes arising from your use of this website and agree to release us from any liability in connection with your use of, or reliance upon, the content or products found herein.