
|
Seino Holdings Co., Ltd. (9076.T) Avaliação DCF |
Totalmente Editável: Adapte-Se Às Suas Necessidades No Excel Ou Planilhas
Design Profissional: Modelos Confiáveis E Padrão Da Indústria
Pré-Construídos Para Uso Rápido E Eficiente
Compatível com MAC/PC, totalmente desbloqueado
Não É Necessária Experiência; Fácil De Seguir
Seino Holdings Co., Ltd. (9076.T) Bundle
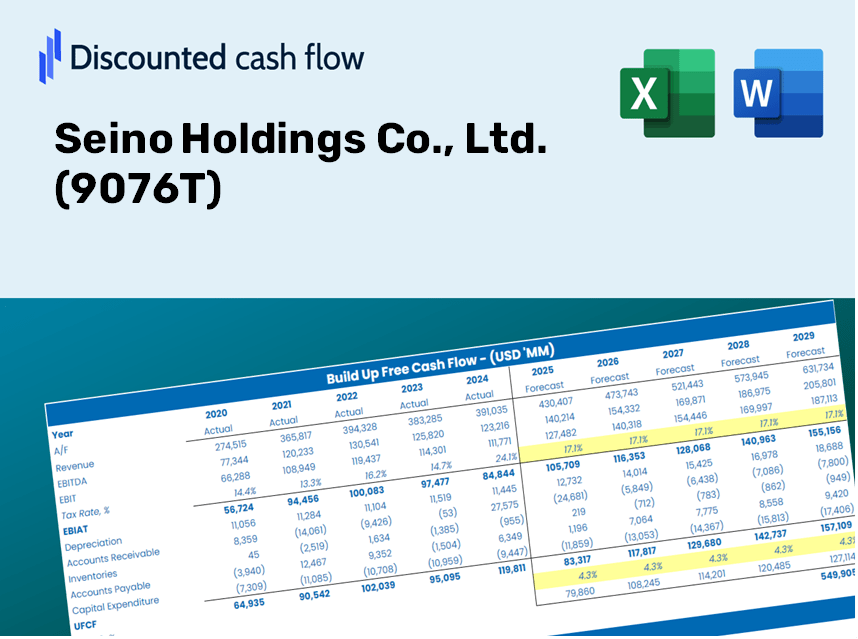
Simplifique a avaliação Seino Holdings Co., Ltd. (9076T) com esta calculadora DCF personalizável! Apresentando a Real Seino Holdings Co., Ltd. (9076T) Financeiras e insumos de previsão ajustáveis, você pode testar cenários e descobrir o valor justo da Seino Holdings Co., Ltd. (9076T) em minutos.
Discounted Cash Flow (DCF) - (USD MM)
| Year | AY1 2021 |
AY2 2022 |
AY3 2023 |
AY4 2024 |
AY5 2025 |
FY1 2026 |
FY2 2027 |
FY3 2028 |
FY4 2029 |
FY5 2030 |
|---|---|---|---|---|---|---|---|---|---|---|
| Revenue | 592,046.0 | 607,657.0 | 631,507.0 | 642,811.0 | 737,377.0 | 779,892.4 | 824,859.1 | 872,418.4 | 922,719.9 | 975,921.7 |
| Revenue Growth, % | 0 | 2.64 | 3.92 | 1.79 | 14.71 | 5.77 | 5.77 | 5.77 | 5.77 | 5.77 |
| EBITDA | 50,018.0 | 50,823.0 | 52,248.0 | 49,854.0 | 59,404.0 | 63,791.1 | 67,469.2 | 71,359.3 | 75,473.7 | 79,825.3 |
| EBITDA, % | 8.45 | 8.36 | 8.27 | 7.76 | 8.06 | 8.18 | 8.18 | 8.18 | 8.18 | 8.18 |
| Depreciation | 21,990.0 | 23,277.0 | 23,746.0 | 23,824.0 | 26,293.0 | 28,976.2 | 30,646.9 | 32,413.9 | 34,282.8 | 36,259.5 |
| Depreciation, % | 3.71 | 3.83 | 3.76 | 3.71 | 3.57 | 3.72 | 3.72 | 3.72 | 3.72 | 3.72 |
| EBIT | 28,028.0 | 27,546.0 | 28,502.0 | 26,030.0 | 33,111.0 | 34,814.9 | 36,822.3 | 38,945.4 | 41,190.9 | 43,565.8 |
| EBIT, % | 4.73 | 4.53 | 4.51 | 4.05 | 4.49 | 4.46 | 4.46 | 4.46 | 4.46 | 4.46 |
| Total Cash | 103,054.0 | 108,488.0 | 109,752.0 | 83,469.0 | 85,121.0 | 120,365.5 | 127,305.5 | 134,645.6 | 142,409.0 | 150,619.9 |
| Total Cash, percent | .0 | .0 | .0 | .0 | .0 | .0 | .0 | .0 | .0 | .0 |
| Account Receivables | 120,188.0 | 119,699.0 | 120,085.0 | 115,575.0 | 118,903.0 | 145,246.0 | 153,620.6 | 162,477.9 | 171,846.0 | 181,754.3 |
| Account Receivables, % | 20.3 | 19.7 | 19.02 | 17.98 | 16.13 | 18.62 | 18.62 | 18.62 | 18.62 | 18.62 |
| Inventories | 13,544.0 | 11,236.0 | 16,388.0 | 20,614.0 | 19,490.0 | 19,624.9 | 20,756.4 | 21,953.2 | 23,218.9 | 24,557.7 |
| Inventories, % | 2.29 | 1.85 | 2.6 | 3.21 | 2.64 | 2.52 | 2.52 | 2.52 | 2.52 | 2.52 |
| Accounts Payable | 48,641.0 | 48,914.0 | 49,874.0 | 58,962.0 | 58,678.0 | 64,408.4 | 68,122.1 | 72,049.8 | 76,204.0 | 80,597.8 |
| Accounts Payable, % | 8.22 | 8.05 | 7.9 | 9.17 | 7.96 | 8.26 | 8.26 | 8.26 | 8.26 | 8.26 |
| Capital Expenditure | -35,453.0 | -29,382.0 | -24,930.0 | -23,400.0 | -38,127.0 | -36,783.0 | -38,903.8 | -41,146.9 | -43,519.3 | -46,028.6 |
| Capital Expenditure, % | -5.99 | -4.84 | -3.95 | -3.64 | -5.17 | -4.72 | -4.72 | -4.72 | -4.72 | -4.72 |
| Tax Rate, % | 40.76 | 40.76 | 40.76 | 40.76 | 40.76 | 40.76 | 40.76 | 40.76 | 40.76 | 40.76 |
| EBITAT | 16,905.5 | 16,768.6 | 17,285.2 | 14,795.8 | 19,616.0 | 20,744.2 | 21,940.3 | 23,205.3 | 24,543.3 | 25,958.4 |
| Depreciation | ||||||||||
| Changes in Account Receivables | ||||||||||
| Changes in Inventories | ||||||||||
| Changes in Accounts Payable | ||||||||||
| Capital Expenditure | ||||||||||
| UFCF | -81,648.5 | 13,733.6 | 11,523.2 | 24,591.8 | 5,294.0 | -7,810.1 | 7,890.9 | 8,345.9 | 8,827.1 | 9,336.0 |
| WACC, % | 4.76 | 4.77 | 4.77 | 4.73 | 4.75 | 4.76 | 4.76 | 4.76 | 4.76 | 4.76 |
| PV UFCF | ||||||||||
| SUM PV UFCF | 21,724.8 | |||||||||
| Long Term Growth Rate, % | 3.00 | |||||||||
| Free cash flow (T + 1) | 9,616 | |||||||||
| Terminal Value | 547,301 | |||||||||
| Present Terminal Value | 433,821 | |||||||||
| Enterprise Value | 455,546 | |||||||||
| Net Debt | 30,265 | |||||||||
| Equity Value | 425,281 | |||||||||
| Diluted Shares Outstanding, MM | 178 | |||||||||
| Equity Value Per Share | 2,389.06 |
What You'll Receive
- Genuine SEINO Financial Data: Pre-filled with Seino's historical and forecasted data for accurate analysis.
- Completely Customizable Template: Easily adjust key inputs like revenue growth, WACC, and EBITDA %.
- Real-Time Calculations: Watch as Seino's intrinsic value updates instantly with your adjustments.
- Expert Valuation Tool: Tailored for investors, analysts, and consultants seeking reliable DCF results.
- Intuitive Design: Straightforward layout and clear instructions suitable for all skill levels.
Key Features
- Comprehensive DCF Calculator: Features both unlevered and levered DCF valuation models tailored for Seino Holdings Co., Ltd. (9076T).
- WACC Estimator: Ready-to-use Weighted Average Cost of Capital tool with adjustable parameters.
- Customizable Forecast Inputs: Easily adjust growth rates, capital expenditures, and discount rates as needed.
- Integrated Financial Ratios: Evaluate profitability, leverage, and efficiency ratios specifically for Seino Holdings Co., Ltd. (9076T).
- Interactive Dashboard and Visualizations: Graphical representations summarize essential valuation metrics for straightforward analysis.
How It Works
- Step 1: Download the Excel file for Seino Holdings Co., Ltd. (9076T).
- Step 2: Review the pre-filled financial data and forecasts provided for Seino Holdings.
- Step 3: Adjust key inputs such as revenue growth, WACC, and tax rates (highlighted cells).
- Step 4: Observe the DCF model update in real-time as you modify your assumptions.
- Step 5: Evaluate the outputs and leverage the results for informed investment decisions.
Why Choose This Calculator for Seino Holdings Co., Ltd. (9076T)?
- All-in-One Solution: Integrates DCF, WACC, and financial ratio analyses for a thorough evaluation.
- Flexible Inputs: Modify the highlighted cells to explore diverse scenarios.
- In-Depth Analysis: Automatically calculates Seino Holdings’ intrinsic value and Net Present Value.
- Preloaded Information: Historical and projected data provide reliable starting points for your analysis.
- Industry Standards: Perfect for financial analysts, investors, and business consultants looking to assess Seino Holdings.
Who Should Utilize Seino Holdings Co., Ltd. (9076T)?
- Private Investors: Gain insights to make smart investment choices regarding Seino Holdings Co., Ltd. (9076T).
- Market Analysts: Enhance valuation analysis with comprehensive financial models at your fingertips.
- Financial Consultants: Provide clients with timely and precise valuation assessments of Seino Holdings Co., Ltd. (9076T).
- Entrepreneurs: Learn how major corporations like Seino Holdings Co., Ltd. (9076T) are appraised to inform your own business strategies.
- Students in Finance: Master valuation methodologies using actual market data and case studies.
Components of the Template
- Pre-Filled Data: Contains Seino Holdings' historical financial data and projections.
- Discounted Cash Flow Model: An editable DCF valuation model with automatic calculations.
- Weighted Average Cost of Capital (WACC): A dedicated sheet for WACC calculation based on customizable inputs.
- Key Financial Ratios: Evaluate Seino Holdings' profitability, efficiency, and leverage metrics.
- Customizable Inputs: Easily adjust revenue growth, profit margins, and tax rates.
- Clear Dashboard: Visual representations and tables summarizing important valuation outcomes.
Disclaimer
All information, articles, and product details provided on this website are for general informational and educational purposes only. We do not claim any ownership over, nor do we intend to infringe upon, any trademarks, copyrights, logos, brand names, or other intellectual property mentioned or depicted on this site. Such intellectual property remains the property of its respective owners, and any references here are made solely for identification or informational purposes, without implying any affiliation, endorsement, or partnership.
We make no representations or warranties, express or implied, regarding the accuracy, completeness, or suitability of any content or products presented. Nothing on this website should be construed as legal, tax, investment, financial, medical, or other professional advice. In addition, no part of this site—including articles or product references—constitutes a solicitation, recommendation, endorsement, advertisement, or offer to buy or sell any securities, franchises, or other financial instruments, particularly in jurisdictions where such activity would be unlawful.
All content is of a general nature and may not address the specific circumstances of any individual or entity. It is not a substitute for professional advice or services. Any actions you take based on the information provided here are strictly at your own risk. You accept full responsibility for any decisions or outcomes arising from your use of this website and agree to release us from any liability in connection with your use of, or reliance upon, the content or products found herein.