
|
Kawasaki Kisen Kaisha, Ltd. (9107.T) Avaliação DCF |
Totalmente Editável: Adapte-Se Às Suas Necessidades No Excel Ou Planilhas
Design Profissional: Modelos Confiáveis E Padrão Da Indústria
Pré-Construídos Para Uso Rápido E Eficiente
Compatível com MAC/PC, totalmente desbloqueado
Não É Necessária Experiência; Fácil De Seguir
Kawasaki Kisen Kaisha, Ltd. (9107.T) Bundle
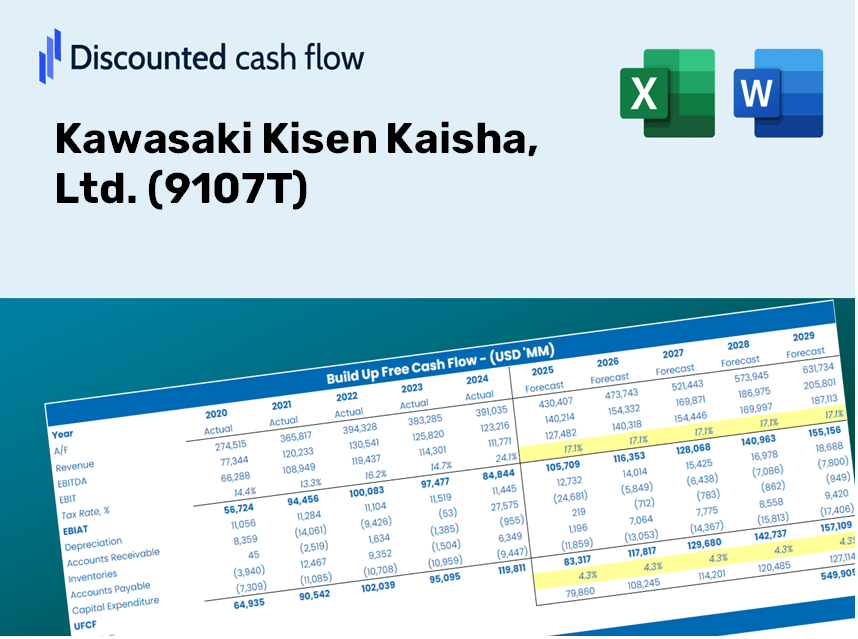
Seja você um investidor ou analista, esta calculadora DCF [símbolo] é o seu recurso preferido para uma avaliação precisa. Carregado com dados reais da Kawasaki Kisen Kaisha, Ltd. (9107T), você pode ajustar as previsões e observar instantaneamente os efeitos.
Discounted Cash Flow (DCF) - (USD MM)
| Year | AY1 2021 |
AY2 2022 |
AY3 2023 |
AY4 2024 |
AY5 2025 |
FY1 2026 |
FY2 2027 |
FY3 2028 |
FY4 2029 |
FY5 2030 |
|---|---|---|---|---|---|---|---|---|---|---|
| Revenue | 625,486.0 | 756,983.0 | 942,606.0 | 962,300.0 | 1,047,944.0 | 1,196,054.7 | 1,365,098.6 | 1,558,034.3 | 1,778,238.4 | 2,029,565.0 |
| Revenue Growth, % | 0 | 21.02 | 24.52 | 2.09 | 8.9 | 14.13 | 14.13 | 14.13 | 14.13 | 14.13 |
| EBITDA | 167,779.0 | 712,219.0 | 745,269.0 | 185,005.0 | 376,449.0 | 610,282.1 | 696,536.0 | 794,980.7 | 907,338.9 | 1,035,577.3 |
| EBITDA, % | 26.82 | 94.09 | 79.06 | 19.23 | 35.92 | 51.02 | 51.02 | 51.02 | 51.02 | 51.02 |
| Depreciation | 43,869.0 | 42,821.0 | 42,396.0 | 44,550.0 | 49,137.0 | 63,358.7 | 72,313.5 | 82,533.9 | 94,198.8 | 107,512.4 |
| Depreciation, % | 7.01 | 5.66 | 4.5 | 4.63 | 4.69 | 5.3 | 5.3 | 5.3 | 5.3 | 5.3 |
| EBIT | 123,910.0 | 669,398.0 | 702,873.0 | 140,455.0 | 327,312.0 | 546,923.3 | 624,222.5 | 712,446.7 | 813,140.1 | 928,064.9 |
| EBIT, % | 19.81 | 88.43 | 74.57 | 14.6 | 31.23 | 45.73 | 45.73 | 45.73 | 45.73 | 45.73 |
| Total Cash | 132,371.0 | 247,344.0 | 349,430.0 | 272,616.0 | 204,716.0 | 331,960.6 | 378,878.1 | 432,426.7 | 493,543.5 | 563,298.3 |
| Total Cash, percent | .0 | .0 | .0 | .0 | .0 | .0 | .0 | .0 | .0 | .0 |
| Account Receivables | 55,210.0 | 102,655.0 | 106,448.0 | 131,320.0 | 118,234.0 | 140,200.8 | 160,016.0 | 182,631.8 | 208,444.0 | 237,904.4 |
| Account Receivables, % | 8.83 | 13.56 | 11.29 | 13.65 | 11.28 | 11.72 | 11.72 | 11.72 | 11.72 | 11.72 |
| Inventories | 22,309.0 | 36,572.0 | 38,356.0 | 42,513.0 | 38,308.0 | 49,135.1 | 56,079.6 | 64,005.6 | 73,051.8 | 83,376.5 |
| Inventories, % | 3.57 | 4.83 | 4.07 | 4.42 | 3.66 | 4.11 | 4.11 | 4.11 | 4.11 | 4.11 |
| Accounts Payable | 51,661.0 | 62,756.0 | 62,803.0 | 77,596.0 | 69,222.0 | 90,616.5 | 103,423.7 | 118,041.1 | 134,724.4 | 153,765.6 |
| Accounts Payable, % | 8.26 | 8.29 | 6.66 | 8.06 | 6.61 | 7.58 | 7.58 | 7.58 | 7.58 | 7.58 |
| Capital Expenditure | -42,123.0 | -41,961.0 | -68,508.0 | -84,862.0 | -132,090.0 | -98,002.1 | -111,853.2 | -127,661.9 | -145,705.0 | -166,298.1 |
| Capital Expenditure, % | -6.73 | -5.54 | -7.27 | -8.82 | -12.6 | -8.19 | -8.19 | -8.19 | -8.19 | -8.19 |
| Tax Rate, % | 4.56 | 4.56 | 4.56 | 4.56 | 4.56 | 4.56 | 4.56 | 4.56 | 4.56 | 4.56 |
| EBITAT | 118,295.3 | 652,468.4 | 704,929.2 | 109,441.2 | 312,388.4 | 510,059.9 | 582,149.0 | 664,426.8 | 758,333.3 | 865,512.0 |
| Depreciation | ||||||||||
| Changes in Account Receivables | ||||||||||
| Changes in Inventories | ||||||||||
| Changes in Accounts Payable | ||||||||||
| Capital Expenditure | ||||||||||
| UFCF | 94,183.3 | 602,715.4 | 673,287.2 | 54,893.2 | 238,352.4 | 464,017.1 | 528,656.8 | 603,374.3 | 688,652.0 | 785,982.3 |
| WACC, % | 10.97 | 10.99 | 11.01 | 10.84 | 10.97 | 10.96 | 10.96 | 10.96 | 10.96 | 10.96 |
| PV UFCF | ||||||||||
| SUM PV UFCF | 2,211,042.4 | |||||||||
| Long Term Growth Rate, % | 2.00 | |||||||||
| Free cash flow (T + 1) | 801,702 | |||||||||
| Terminal Value | 8,951,591 | |||||||||
| Present Terminal Value | 5,322,881 | |||||||||
| Enterprise Value | 7,533,924 | |||||||||
| Net Debt | 140,144 | |||||||||
| Equity Value | 7,393,780 | |||||||||
| Diluted Shares Outstanding, MM | 664 | |||||||||
| Equity Value Per Share | 11,139.91 |
What You Will Receive
- Customizable Excel Template: A fully adjustable Excel-based DCF Calculator featuring pre-populated financial data from Kawasaki Kisen Kaisha, Ltd. (9107T).
- Real-Time Data: Access to historical performance metrics and forward-looking projections (as indicated in the highlighted cells).
- Flexible Forecasting: Adapt key assumptions such as revenue growth rate, EBITDA margin, and WACC as needed.
- Instant Calculations: Quickly observe how changes in your inputs affect the valuation of Kawasaki Kisen Kaisha, Ltd. (9107T).
- Professional Resource: Designed for investors, CFOs, consultants, and financial analysts alike.
- User-Centric Layout: Organized for simplicity and ease of navigation, complete with detailed instructions.
Key Features
- Real-Time K Line Data: Comes pre-loaded with Kawasaki Kisen Kaisha, Ltd.’s historical financials and future growth projections.
- Completely Customizable Inputs: Modify revenue growth rates, profit margins, WACC, tax rates, and capital investments to fit your needs.
- Interactive Valuation Model: Automatically recalculates Net Present Value (NPV) and intrinsic value as you adjust your inputs.
- Scenario Analysis: Develop various forecasting scenarios to evaluate different valuation possibilities.
- Intuitive User Interface: Designed for ease of use, making it suitable for both seasoned professionals and newcomers.
How It Functions
- Download the Template: Obtain immediate access to the Excel-based KKK DCF Calculator for Kawasaki Kisen Kaisha, Ltd. (9107T).
- Input Your Assumptions: Modify the yellow-highlighted cells for growth rates, WACC, profit margins, and other variables.
- Instant Calculations: The model automatically recalculates the intrinsic value of Kawasaki Kisen Kaisha, Ltd. (9107T).
- Test Scenarios: Explore various assumptions to assess potential changes in valuation.
- Analyze and Decide: Leverage the outcomes to inform your investment or financial strategies.
Why Choose This Calculator for Kawasaki Kisen Kaisha, Ltd. (9107T)?
- User-Friendly Interface: Perfectly crafted for both novices and seasoned professionals.
- Customizable Inputs: Adjust parameters easily to suit your financial analysis needs.
- Real-Time Valuation: Monitor immediate impacts on Kawasaki Kisen Kaisha’s valuation as you tweak the variables.
- Pre-Loaded Data: Comes equipped with Kawasaki Kisen Kaisha's actual financial statistics for fast evaluations.
- Preferred by Experts: A go-to tool for investors and analysts seeking to make strategic decisions.
Who Should Utilize This Product?
- Investors: Accurately assess Kawasaki Kisen Kaisha, Ltd.'s (9107T) fair value prior to making investment choices.
- CFOs: Utilize an advanced DCF model for robust financial reporting and analysis.
- Consultants: Easily customize the template for valuation reports tailored to client needs.
- Entrepreneurs: Acquire insights into financial modeling practices employed by top-tier shipping companies.
- Educators: Employ it as a teaching resource to illustrate valuation techniques.
What the Template Includes
- Historical Data: Features Kawasaki Kisen Kaisha, Ltd.'s past financial performance and baseline forecasts.
- DCF and Levered DCF Models: Comprehensive templates designed to determine the intrinsic value of Kawasaki Kisen Kaisha, Ltd. (9107T).
- WACC Sheet: Pre-configured calculations for the Weighted Average Cost of Capital.
- Editable Inputs: Adjust crucial variables such as growth rates, EBITDA %, and CAPEX assumptions.
- Quarterly and Annual Statements: A detailed overview of Kawasaki Kisen Kaisha, Ltd.'s financials.
- Interactive Dashboard: Dynamically visualize valuation results and forecasts.
Disclaimer
All information, articles, and product details provided on this website are for general informational and educational purposes only. We do not claim any ownership over, nor do we intend to infringe upon, any trademarks, copyrights, logos, brand names, or other intellectual property mentioned or depicted on this site. Such intellectual property remains the property of its respective owners, and any references here are made solely for identification or informational purposes, without implying any affiliation, endorsement, or partnership.
We make no representations or warranties, express or implied, regarding the accuracy, completeness, or suitability of any content or products presented. Nothing on this website should be construed as legal, tax, investment, financial, medical, or other professional advice. In addition, no part of this site—including articles or product references—constitutes a solicitation, recommendation, endorsement, advertisement, or offer to buy or sell any securities, franchises, or other financial instruments, particularly in jurisdictions where such activity would be unlawful.
All content is of a general nature and may not address the specific circumstances of any individual or entity. It is not a substitute for professional advice or services. Any actions you take based on the information provided here are strictly at your own risk. You accept full responsibility for any decisions or outcomes arising from your use of this website and agree to release us from any liability in connection with your use of, or reliance upon, the content or products found herein.