
|
KDDI Corporation (9433.T) Avaliação DCF |
Totalmente Editável: Adapte-Se Às Suas Necessidades No Excel Ou Planilhas
Design Profissional: Modelos Confiáveis E Padrão Da Indústria
Pré-Construídos Para Uso Rápido E Eficiente
Compatível com MAC/PC, totalmente desbloqueado
Não É Necessária Experiência; Fácil De Seguir
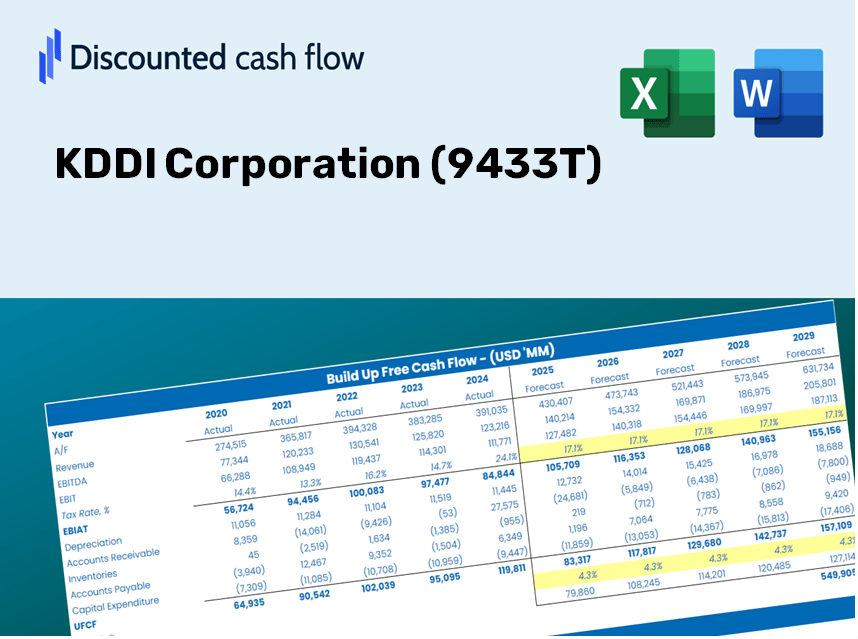
KDDI Corporation (9433.T) Bundle
Simplifique a avaliação da KDDI Corporation (9433T) com esta calculadora DCF personalizável! Apresentando o Real KDDI Corporation (9433T) Financeiras e entradas de previsão ajustável, você pode testar cenários e descobrir o valor justo da KDDI Corporation (9433T) em minutos.
Discounted Cash Flow (DCF) - (USD MM)
| Year | AY1 2020 |
AY2 2021 |
AY3 2022 |
AY4 2023 |
AY5 2024 |
FY1 2025 |
FY2 2026 |
FY3 2027 |
FY4 2028 |
FY5 2029 |
|---|---|---|---|---|---|---|---|---|---|---|
| Revenue | 5,312,599.0 | 5,446,708.0 | 5,671,762.0 | 5,754,047.0 | 5,917,953.0 | 6,080,039.9 | 6,246,566.1 | 6,417,653.3 | 6,593,426.5 | 6,774,013.9 |
| Revenue Growth, % | 0 | 2.52 | 4.13 | 1.45 | 2.85 | 2.74 | 2.74 | 2.74 | 2.74 | 2.74 |
| EBITDA | 1,758,005.0 | 1,781,508.0 | 1,711,358.0 | 1,621,993.0 | 1,777,960.0 | 1,875,142.1 | 1,926,500.4 | 1,979,265.3 | 2,033,475.4 | 2,089,170.3 |
| EBITDA, % | 33.09 | 32.71 | 30.17 | 28.19 | 30.04 | 30.84 | 30.84 | 30.84 | 30.84 | 30.84 |
| Depreciation | 727,438.0 | 728,101.0 | 697,152.0 | 687,349.0 | 686,788.0 | 764,901.9 | 785,851.8 | 807,375.5 | 829,488.7 | 852,207.5 |
| Depreciation, % | 13.69 | 13.37 | 12.29 | 11.95 | 11.61 | 12.58 | 12.58 | 12.58 | 12.58 | 12.58 |
| EBIT | 1,030,567.0 | 1,053,407.0 | 1,014,206.0 | 934,644.0 | 1,091,172.0 | 1,110,240.2 | 1,140,648.6 | 1,171,889.8 | 1,203,986.7 | 1,236,962.7 |
| EBIT, % | 19.4 | 19.34 | 17.88 | 16.24 | 18.44 | 18.26 | 18.26 | 18.26 | 18.26 | 18.26 |
| Total Cash | 840,074.0 | 819,050.0 | 504,617.0 | 907,732.0 | 944,140.0 | 869,163.1 | 892,968.6 | 917,426.1 | 942,553.5 | 968,369.1 |
| Total Cash, percent | .0 | .0 | .0 | .0 | .0 | .0 | .0 | .0 | .0 | .0 |
| Account Receivables | 2,540,452.0 | 2,650,050.0 | 2,835,246.0 | 3,100,406.0 | 3,559,959.0 | 3,167,698.0 | 3,254,458.1 | 3,343,594.4 | 3,435,172.2 | 3,529,258.1 |
| Account Receivables, % | 47.82 | 48.65 | 49.99 | 53.88 | 60.16 | 52.1 | 52.1 | 52.1 | 52.1 | 52.1 |
| Inventories | 69,821.0 | 74,511.0 | 99,038.0 | 91,290.0 | 132,743.0 | 100,418.0 | 103,168.3 | 105,994.0 | 108,897.1 | 111,879.7 |
| Inventories, % | 1.31 | 1.37 | 1.75 | 1.59 | 2.24 | 1.65 | 1.65 | 1.65 | 1.65 | 1.65 |
| Accounts Payable | 142,163.0 | 176,842.0 | 172,402.0 | 196,920.0 | 268,165.0 | 205,700.5 | 211,334.5 | 217,122.7 | 223,069.5 | 229,179.1 |
| Accounts Payable, % | 2.68 | 3.25 | 3.04 | 3.42 | 4.53 | 3.38 | 3.38 | 3.38 | 3.38 | 3.38 |
| Capital Expenditure | -414,722.0 | -425,800.0 | -394,652.0 | -523,940.0 | -400,947.0 | -467,711.1 | -480,521.2 | -493,682.2 | -507,203.7 | -521,095.5 |
| Capital Expenditure, % | -7.81 | -7.82 | -6.96 | -9.11 | -6.78 | -7.69 | -7.69 | -7.69 | -7.69 | -7.69 |
| Tax Rate, % | 37.93 | 37.93 | 37.93 | 37.93 | 37.93 | 37.93 | 37.93 | 37.93 | 37.93 | 37.93 |
| EBITAT | 646,795.8 | 665,480.0 | 638,996.1 | 600,554.1 | 677,326.9 | 700,046.4 | 719,220.0 | 738,918.7 | 759,156.9 | 779,949.5 |
| Depreciation | ||||||||||
| Changes in Account Receivables | ||||||||||
| Changes in Inventories | ||||||||||
| Changes in Accounts Payable | ||||||||||
| Capital Expenditure | ||||||||||
| UFCF | -1,508,598.2 | 888,172.0 | 727,333.1 | 531,069.1 | 533,406.9 | 1,359,358.8 | 940,674.0 | 966,438.1 | 992,907.9 | 1,020,102.7 |
| WACC, % | 3.81 | 3.82 | 3.82 | 3.83 | 3.8 | 3.82 | 3.82 | 3.82 | 3.82 | 3.82 |
| PV UFCF | ||||||||||
| SUM PV UFCF | 4,746,631.8 | |||||||||
| Long Term Growth Rate, % | 1.00 | |||||||||
| Free cash flow (T + 1) | 1,030,304 | |||||||||
| Terminal Value | 36,590,522 | |||||||||
| Present Terminal Value | 30,342,547 | |||||||||
| Enterprise Value | 35,089,178 | |||||||||
| Net Debt | 3,517,266 | |||||||||
| Equity Value | 31,571,912 | |||||||||
| Diluted Shares Outstanding, MM | 4,051 | |||||||||
| Equity Value Per Share | 7,794.46 |
What You Will Receive
- Flexible Forecast Inputs: Easily modify assumptions (growth %, margins, WACC) to generate various scenarios.
- Real-World Data: KDDI Corporation’s (9433T) financial data pre-loaded to accelerate your analysis.
- Automated DCF Outputs: The template computes Net Present Value (NPV) and intrinsic value automatically.
- Customizable and Professional: A sophisticated Excel model tailored to meet your valuation requirements.
- Designed for Analysts and Investors: Perfect for evaluating projections, validating strategies, and optimizing time efficiency.
Key Features
- Real-Life KDDI Data: Pre-filled with KDDI Corporation’s historical financials and forward-looking projections.
- Fully Customizable Inputs: Tailor revenue growth, profit margins, WACC, tax rates, and capital expenditures to your preferences.
- Dynamic Valuation Model: Automatic adjustments to Net Present Value (NPV) and intrinsic value based on your user-defined inputs.
- Scenario Testing: Develop multiple forecast scenarios to explore various valuation outcomes.
- User-Friendly Design: Intuitive, structured, and suitable for both professionals and newcomers.
How It Operates
- Step 1: Download the Excel spreadsheet.
- Step 2: Examine the pre-filled KDDI data (historical and forecasted).
- Step 3: Modify key assumptions (highlighted in yellow) according to your insights.
- Step 4: Observe automatic updates reflecting KDDI’s intrinsic value.
- Step 5: Utilize the results for investment strategies or reporting purposes.
Why Choose This Calculator for KDDI Corporation (9433T)?
- Precision: Leverage accurate KDDI financials for reliable data.
- Adaptability: Tailored for users to easily adjust and experiment with inputs.
- Efficiency: Eliminate the complexities of constructing a DCF model from the ground up.
- Expert-Quality: Created with the rigor and usability preferred by CFOs.
- Accessible: Intuitive design allows even beginners in financial modeling to navigate effortlessly.
Who Can Benefit from This Product?
- Investors: Effectively evaluate KDDI Corporation's fair value before making investment decisions.
- CFOs: Utilize a high-quality DCF model for financial reporting and analysis pertaining to KDDI Corporation (9433T).
- Consultants: Easily modify the template for valuation reports tailored to clients involving KDDI Corporation (9433T).
- Entrepreneurs: Acquire insights into financial modeling practices prevalent among leading companies like KDDI Corporation (9433T).
- Educators: Employ this resource as a teaching aid to illustrate valuation methodologies relevant to KDDI Corporation (9433T).
Contents of the Template
- Preloaded KDDI Data: Historical and projected financial information, including revenue, EBIT, and capital expenditures.
- DCF and WACC Models: Advanced spreadsheets for calculating intrinsic value and Weighted Average Cost of Capital.
- Editable Inputs: Cells highlighted in yellow for customizing revenue growth, tax rates, and discount rates.
- Financial Statements: Detailed annual and quarterly financial statements for in-depth analysis.
- Key Ratios: Ratios related to profitability, leverage, and efficiency for performance evaluation.
- Dashboard and Charts: Visual representations of valuation results and assumptions.
Disclaimer
All information, articles, and product details provided on this website are for general informational and educational purposes only. We do not claim any ownership over, nor do we intend to infringe upon, any trademarks, copyrights, logos, brand names, or other intellectual property mentioned or depicted on this site. Such intellectual property remains the property of its respective owners, and any references here are made solely for identification or informational purposes, without implying any affiliation, endorsement, or partnership.
We make no representations or warranties, express or implied, regarding the accuracy, completeness, or suitability of any content or products presented. Nothing on this website should be construed as legal, tax, investment, financial, medical, or other professional advice. In addition, no part of this site—including articles or product references—constitutes a solicitation, recommendation, endorsement, advertisement, or offer to buy or sell any securities, franchises, or other financial instruments, particularly in jurisdictions where such activity would be unlawful.
All content is of a general nature and may not address the specific circumstances of any individual or entity. It is not a substitute for professional advice or services. Any actions you take based on the information provided here are strictly at your own risk. You accept full responsibility for any decisions or outcomes arising from your use of this website and agree to release us from any liability in connection with your use of, or reliance upon, the content or products found herein.