
|
Tokyo Electric Power Company Holdings, Incorporated (9501.T) DCF Avaliação |
Totalmente Editável: Adapte-Se Às Suas Necessidades No Excel Ou Planilhas
Design Profissional: Modelos Confiáveis E Padrão Da Indústria
Pré-Construídos Para Uso Rápido E Eficiente
Compatível com MAC/PC, totalmente desbloqueado
Não É Necessária Experiência; Fácil De Seguir
Tokyo Electric Power Company Holdings, Incorporated (9501.T) Bundle
Seja você um investidor ou analista, esta calculadora DCF (9501T) é o seu recurso preferido para uma avaliação precisa. Carregado com dados reais da Tokyo Electric Power Company Holdings, Incorporated, você pode ajustar facilmente as previsões e observar instantaneamente os efeitos.
What You Will Receive
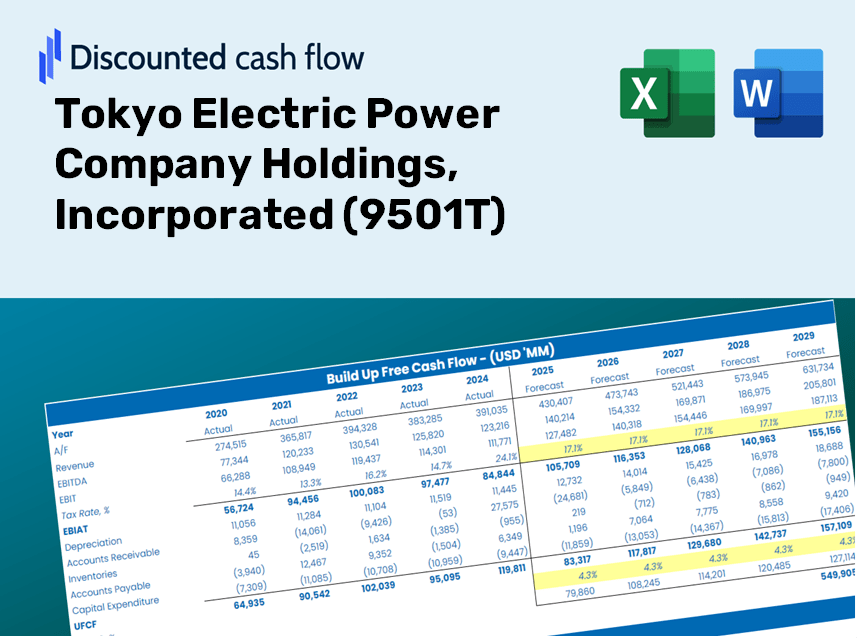
- Genuine TEPCO Data: Preloaded financial information – covering everything from revenue to EBIT – based on actual and projected figures.
- Complete Customization: Modify all key parameters (yellow cells) such as WACC, growth %, and tax rates.
- Immediate Valuation Updates: Automatic recalculations allow you to assess how changes affect TEPCO's fair value.
- Flexible Excel Template: Designed for quick adjustments, scenario analysis, and detailed forecasts.
- Efficient and Accurate: Bypass the hassle of building models from the ground up while ensuring precision and adaptability.
Key Features
- Comprehensive DCF Calculator: Features both unlevered and levered DCF valuation models tailored for Tokyo Electric Power Company Holdings, Incorporated (9501T).
- WACC Calculator: Comes with a pre-configured Weighted Average Cost of Capital worksheet that allows for easy customization.
- Adjustable Forecast Assumptions: Tailor growth rates, capital expenditures, and discount rates to suit your analysis.
- Integrated Financial Ratios: Assess profitability, leverage, and efficiency ratios specific to Tokyo Electric Power Company Holdings, Incorporated (9501T).
- Visual Dashboard and Charts: Provides graphical representations to summarize essential valuation metrics for straightforward analysis.
How It Works
- Step 1: Download the Excel file.
- Step 2: Examine Tokyo Electric Power Company Holdings, Incorporated’s (9501T) pre-filled financial data and forecasts.
- Step 3: Adjust key inputs such as revenue growth, WACC, and tax rates (highlighted cells).
- Step 4: Observe the DCF model update in real-time as you change your assumptions.
- Step 5: Evaluate the results and leverage the insights for your investment strategies.
Why Opt for this Calculator?
- Time Efficient: Skip the hassle of building a DCF model from the ground up – it's instantly ready to be utilized.
- Enhanced Precision: Dependable financial data and formulas minimize valuation errors.
- Completely Customizable: Adjust the model to align with your unique assumptions and forecasts.
- User-Friendly: Intuitive charts and outputs simplify the analysis of results.
- Endorsed by Professionals: Crafted for specialists who prioritize accuracy and functionality.
Who Can Benefit from This Product?
- Investors: Accurately assess the fair value of Tokyo Electric Power Company Holdings, Inc. (9501T) before making investment choices.
- CFOs: Utilize a professional-grade DCF model for comprehensive financial reporting and analysis.
- Consultants: Efficiently customize the template for client valuation reports.
- Entrepreneurs: Acquire insights into the financial modeling techniques employed by industry leaders.
- Educators: Employ this tool to illustrate various valuation methodologies in the classroom.
Components of the Template
- Operating and Balance Sheet Data: Pre-filled historical data and forecasts for Tokyo Electric Power Company Holdings (9501T), including metrics such as revenue, EBITDA, EBIT, and capital expenditures.
- WACC Calculation: A dedicated sheet for calculating the Weighted Average Cost of Capital (WACC), featuring parameters like Beta, risk-free rate, and share price.
- DCF Valuation (Unlevered and Levered): Customizable Discounted Cash Flow models that display intrinsic value along with comprehensive calculations.
- Financial Statements: Pre-loaded annual and quarterly financial statements designed to facilitate in-depth analysis.
- Key Ratios: Includes a range of profitability, leverage, and efficiency ratios specific to Tokyo Electric Power Company Holdings (9501T).
- Dashboard and Charts: A visual summary of valuation outputs and assumptions to simplify result analysis.
Disclaimer
All information, articles, and product details provided on this website are for general informational and educational purposes only. We do not claim any ownership over, nor do we intend to infringe upon, any trademarks, copyrights, logos, brand names, or other intellectual property mentioned or depicted on this site. Such intellectual property remains the property of its respective owners, and any references here are made solely for identification or informational purposes, without implying any affiliation, endorsement, or partnership.
We make no representations or warranties, express or implied, regarding the accuracy, completeness, or suitability of any content or products presented. Nothing on this website should be construed as legal, tax, investment, financial, medical, or other professional advice. In addition, no part of this site—including articles or product references—constitutes a solicitation, recommendation, endorsement, advertisement, or offer to buy or sell any securities, franchises, or other financial instruments, particularly in jurisdictions where such activity would be unlawful.
All content is of a general nature and may not address the specific circumstances of any individual or entity. It is not a substitute for professional advice or services. Any actions you take based on the information provided here are strictly at your own risk. You accept full responsibility for any decisions or outcomes arising from your use of this website and agree to release us from any liability in connection with your use of, or reliance upon, the content or products found herein.