
|
Hokuriku Electric Power Company (9505.T) DCF Avaliação |
Totalmente Editável: Adapte-Se Às Suas Necessidades No Excel Ou Planilhas
Design Profissional: Modelos Confiáveis E Padrão Da Indústria
Pré-Construídos Para Uso Rápido E Eficiente
Compatível com MAC/PC, totalmente desbloqueado
Não É Necessária Experiência; Fácil De Seguir
Hokuriku Electric Power Company (9505.T) Bundle
Simplifique a avaliação da Hokuriku Electric Power Company (9505T) com esta calculadora DCF personalizável! Com a autêntica Hokuriku Electric Power Company (9505T) e contribuições de previsão ajustáveis, você pode explorar diferentes cenários e determinar o valor justo da Hokuriku Electric Power Company (9505T) em apenas minutos.
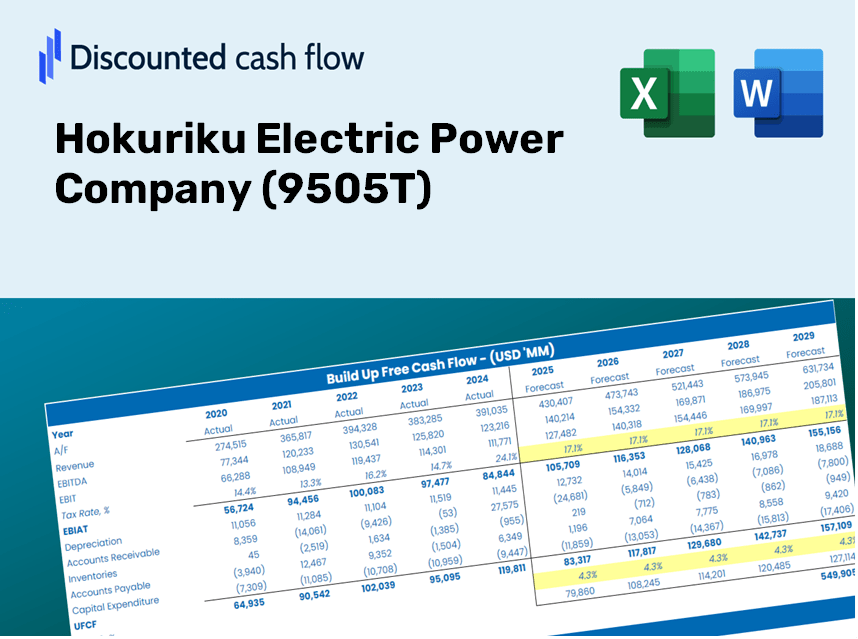
Discounted Cash Flow (DCF) - (USD MM)
| Year | AY1 2020 |
AY2 2021 |
AY3 2022 |
AY4 2023 |
AY5 2024 |
FY1 2025 |
FY2 2026 |
FY3 2027 |
FY4 2028 |
FY5 2029 |
|---|---|---|---|---|---|---|---|---|---|---|
| Revenue | 639,445.0 | 613,756.0 | 817,601.0 | 808,238.0 | 858,275.0 | 931,745.5 | 1,011,505.3 | 1,098,092.7 | 1,192,092.2 | 1,294,138.4 |
| Revenue Growth, % | 0 | -4.02 | 33.21 | -1.15 | 6.19 | 8.56 | 8.56 | 8.56 | 8.56 | 8.56 |
| EBITDA | 77,964.0 | 64,971.0 | -22,993.0 | 135,789.0 | 167,392.0 | 104,858.5 | 113,834.7 | 123,579.2 | 134,157.9 | 145,642.1 |
| EBITDA, % | 12.19 | 10.59 | -2.81 | 16.8 | 19.5 | 11.25 | 11.25 | 11.25 | 11.25 | 11.25 |
| Depreciation | 58,517.0 | 59,647.0 | 63,521.0 | 65,229.0 | 63,787.0 | 78,529.9 | 85,252.3 | 92,550.1 | 100,472.6 | 109,073.3 |
| Depreciation, % | 9.15 | 9.72 | 7.77 | 8.07 | 7.43 | 8.43 | 8.43 | 8.43 | 8.43 | 8.43 |
| EBIT | 19,447.0 | 5,324.0 | -86,514.0 | 70,560.0 | 103,605.0 | 26,328.6 | 28,582.4 | 31,029.1 | 33,685.3 | 36,568.8 |
| EBIT, % | 3.04 | 0.86745 | -10.58 | 8.73 | 12.07 | 2.83 | 2.83 | 2.83 | 2.83 | 2.83 |
| Total Cash | 132,310.0 | 105,602.0 | 165,463.0 | 225,039.0 | 239,372.0 | 212,191.8 | 230,356.0 | 250,075.1 | 271,482.1 | 294,721.7 |
| Total Cash, percent | .0 | .0 | .0 | .0 | .0 | .0 | .0 | .0 | .0 | .0 |
| Account Receivables | 70,688.0 | 80,030.0 | 79,461.0 | 85,710.0 | 97,689.0 | 103,981.6 | 112,882.6 | 122,545.7 | 133,035.9 | 144,424.1 |
| Account Receivables, % | 11.05 | 13.04 | 9.72 | 10.6 | 11.38 | 11.16 | 11.16 | 11.16 | 11.16 | 11.16 |
| Inventories | 27,203.0 | 29,225.0 | 62,380.0 | 47,209.0 | 37,460.0 | 50,036.6 | 54,319.9 | 58,969.8 | 64,017.8 | 69,497.8 |
| Inventories, % | 4.25 | 4.76 | 7.63 | 5.84 | 4.36 | 5.37 | 5.37 | 5.37 | 5.37 | 5.37 |
| Accounts Payable | 33,585.0 | 59,876.0 | 45,966.0 | 49,883.0 | 63,674.0 | 63,769.8 | 69,228.6 | 75,154.8 | 81,588.2 | 88,572.4 |
| Accounts Payable, % | 5.25 | 9.76 | 5.62 | 6.17 | 7.42 | 6.84 | 6.84 | 6.84 | 6.84 | 6.84 |
| Capital Expenditure | -86,938.0 | -83,368.0 | -82,422.0 | -70,473.0 | -86,641.0 | -104,493.7 | -113,438.7 | -123,149.3 | -133,691.2 | -145,135.5 |
| Capital Expenditure, % | -13.6 | -13.58 | -10.08 | -8.72 | -10.09 | -11.21 | -11.21 | -11.21 | -11.21 | -11.21 |
| Tax Rate, % | 32.3 | 32.3 | 32.3 | 32.3 | 32.3 | 32.3 | 32.3 | 32.3 | 32.3 | 32.3 |
| EBITAT | 10,605.8 | 28,754.7 | -81,630.7 | 63,566.8 | 70,143.4 | 21,414.8 | 23,248.0 | 25,238.1 | 27,398.5 | 29,743.9 |
| Depreciation | ||||||||||
| Changes in Account Receivables | ||||||||||
| Changes in Inventories | ||||||||||
| Changes in Accounts Payable | ||||||||||
| Capital Expenditure | ||||||||||
| UFCF | -82,121.2 | 19,960.7 | -147,027.7 | 71,161.8 | 58,850.4 | -23,322.4 | -12,663.9 | -13,747.9 | -14,924.8 | -16,202.4 |
| WACC, % | 2.58 | 3.98 | 3.81 | 3.67 | 2.98 | 3.4 | 3.4 | 3.4 | 3.4 | 3.4 |
| PV UFCF | ||||||||||
| SUM PV UFCF | -73,593.0 | |||||||||
| Long Term Growth Rate, % | 2.00 | |||||||||
| Free cash flow (T + 1) | -16,526 | |||||||||
| Terminal Value | -1,177,166 | |||||||||
| Present Terminal Value | -995,755 | |||||||||
| Enterprise Value | -1,069,348 | |||||||||
| Net Debt | 911,081 | |||||||||
| Equity Value | -1,980,429 | |||||||||
| Diluted Shares Outstanding, MM | 209 | |||||||||
| Equity Value Per Share | -9,483.86 |
Benefits You Will Receive
- Pre-Populated Financial Model: Utilize Hokuriku Electric Power Company’s (9505T) actual figures for accurate DCF assessments.
- Comprehensive Forecasting Control: Adjust key metrics such as revenue growth, profit margins, and WACC as needed.
- Real-Time Calculations: Enjoy automatic updates that reflect changes instantly in your results.
- Professional-Grade Template: A polished Excel file crafted for high-quality valuation purposes.
- Flexible and Reusable: Designed for adaptability, allowing for repeated application in detailed forecasting.
Key Features
- Real-Life (9505T) Data: Pre-filled with Hokuriku Electric Power Company’s historical financial performance and future projections.
- Fully Customizable Inputs: Tailor revenue growth, profit margins, WACC, tax rates, and capital expenditures to your needs.
- Dynamic Valuation Model: Automatic recalculations of Net Present Value (NPV) and intrinsic value based on your adjustments.
- Scenario Testing: Generate multiple forecasting scenarios to explore various valuation possibilities.
- User-Friendly Design: Intuitive layout suited for both professionals and newcomers.
How It Functions
- Download the Template: Gain immediate access to the Excel-based DCF Calculator for Hokuriku Electric Power Company (9505T).
- Input Your Assumptions: Modify the yellow-highlighted cells to reflect growth rates, WACC, margins, and other necessary variables.
- Instant Calculations: The model will automatically recalculate Hokuriku Electric's intrinsic value.
- Test Scenarios: Experiment with various assumptions to assess possible changes in valuation.
- Analyze and Decide: Utilize the outcomes to inform your investment or financial decisions.
Why Opt for This Calculator?
- Designed for Experts: A sophisticated tool utilized by financial analysts, CFOs, and industry consultants.
- Accurate Data: Historical and projected financials for Hokuriku Electric Power Company (9505T) preloaded for precision.
- Forecast Simulation: Easily test various scenarios and assumptions.
- Concise Results: Automatically computes intrinsic value, NPV, and essential metrics.
- User-Friendly: Clear, step-by-step guidance takes you through the entire process.
Who Can Benefit from This Product?
- Institutional Investors: Develop comprehensive and accurate valuation models for analyzing portfolios related to Hokuriku Electric Power Company (9505T).
- Corporate Finance Departments: Evaluate various valuation scenarios to inform strategic decisions within their organizations.
- Financial Consultants and Advisors: Deliver precise valuation insights for clients interested in Hokuriku Electric Power Company (9505T).
- Academics and Students: Utilize real market data to enhance practice and education in financial modeling.
- Energy Sector Enthusiasts: Gain insights into how utility companies like Hokuriku Electric Power Company (9505T) are valued in the marketplace.
Contents of the Template
- Pre-Filled DCF Model: Hokuriku Electric Power Company's financial data preloaded for immediate analysis.
- WACC Calculator: Comprehensive calculations for the Weighted Average Cost of Capital.
- Financial Ratios: Assess Hokuriku Electric’s profitability, leverage, and operational efficiency.
- Editable Inputs: Adjust assumptions like growth rates, margins, and capital expenditures to suit your scenarios.
- Financial Statements: Access annual and quarterly reports for in-depth analysis.
- Interactive Dashboard: Effortlessly visualize key valuation metrics and outcomes.
Disclaimer
All information, articles, and product details provided on this website are for general informational and educational purposes only. We do not claim any ownership over, nor do we intend to infringe upon, any trademarks, copyrights, logos, brand names, or other intellectual property mentioned or depicted on this site. Such intellectual property remains the property of its respective owners, and any references here are made solely for identification or informational purposes, without implying any affiliation, endorsement, or partnership.
We make no representations or warranties, express or implied, regarding the accuracy, completeness, or suitability of any content or products presented. Nothing on this website should be construed as legal, tax, investment, financial, medical, or other professional advice. In addition, no part of this site—including articles or product references—constitutes a solicitation, recommendation, endorsement, advertisement, or offer to buy or sell any securities, franchises, or other financial instruments, particularly in jurisdictions where such activity would be unlawful.
All content is of a general nature and may not address the specific circumstances of any individual or entity. It is not a substitute for professional advice or services. Any actions you take based on the information provided here are strictly at your own risk. You accept full responsibility for any decisions or outcomes arising from your use of this website and agree to release us from any liability in connection with your use of, or reliance upon, the content or products found herein.