
|
Toho Gas Co., Ltd. (9533.T) Avaliação DCF |
Totalmente Editável: Adapte-Se Às Suas Necessidades No Excel Ou Planilhas
Design Profissional: Modelos Confiáveis E Padrão Da Indústria
Pré-Construídos Para Uso Rápido E Eficiente
Compatível com MAC/PC, totalmente desbloqueado
Não É Necessária Experiência; Fácil De Seguir
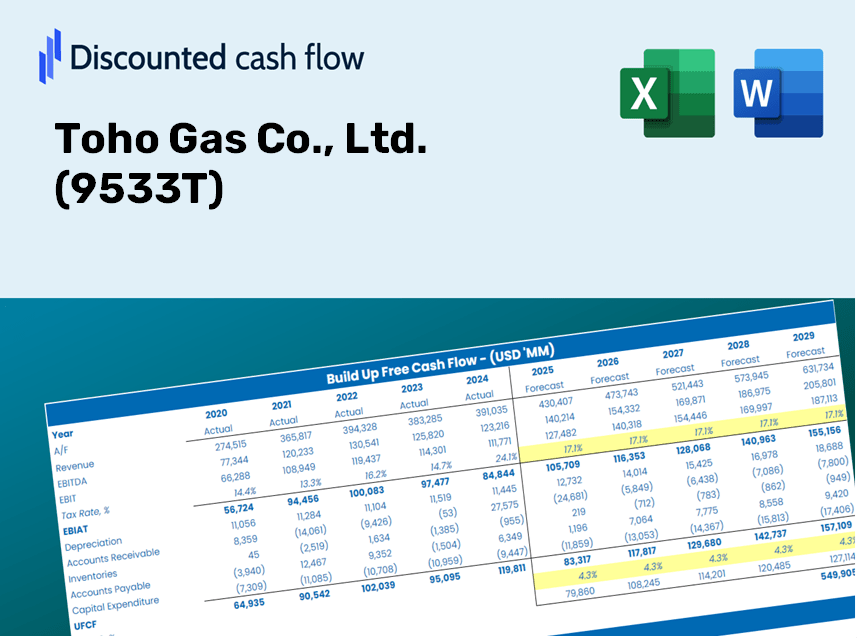
Toho Gas Co., Ltd. (9533.T) Bundle
Avalie as perspectivas financeiras da Toho Gas Co., Ltd. Como um especialista! Esta calculadora DCF (9533T) fornece dados financeiros pré-preenchidos e oferece total flexibilidade para modificar o crescimento da receita, o WACC, as margens e outras suposições críticas para se alinhar às suas previsões.
Discounted Cash Flow (DCF) - (USD MM)
| Year | AY1 2020 |
AY2 2021 |
AY3 2022 |
AY4 2023 |
AY5 2024 |
FY1 2025 |
FY2 2026 |
FY3 2027 |
FY4 2028 |
FY5 2029 |
|---|---|---|---|---|---|---|---|---|---|---|
| Revenue | 434,776.0 | 515,313.0 | 706,073.0 | 632,985.0 | 656,010.0 | 736,089.6 | 825,944.5 | 926,768.1 | 1,039,899.3 | 1,166,840.4 |
| Revenue Growth, % | 0 | 18.52 | 37.02 | -10.35 | 3.64 | 12.21 | 12.21 | 12.21 | 12.21 | 12.21 |
| EBITDA | 51,917.0 | 58,577.0 | 85,401.0 | 79,522.0 | 76,672.0 | 87,821.7 | 98,542.1 | 110,571.2 | 124,068.7 | 139,213.9 |
| EBITDA, % | 11.94 | 11.37 | 12.1 | 12.56 | 11.69 | 11.93 | 11.93 | 11.93 | 11.93 | 11.93 |
| Depreciation | 37,842.0 | 36,523.0 | 37,042.0 | 38,530.0 | 37,955.0 | 48,449.9 | 54,364.2 | 61,000.4 | 68,446.8 | 76,802.1 |
| Depreciation, % | 8.7 | 7.09 | 5.25 | 6.09 | 5.79 | 6.58 | 6.58 | 6.58 | 6.58 | 6.58 |
| EBIT | 14,075.0 | 22,054.0 | 48,359.0 | 40,992.0 | 38,717.0 | 39,371.8 | 44,178.0 | 49,570.8 | 55,621.9 | 62,411.8 |
| EBIT, % | 3.24 | 4.28 | 6.85 | 6.48 | 5.9 | 5.35 | 5.35 | 5.35 | 5.35 | 5.35 |
| Total Cash | 50,731.0 | 32,298.0 | 34,013.0 | 29,774.0 | 46,749.0 | 50,912.6 | 57,127.6 | 64,101.2 | 71,926.0 | 80,706.1 |
| Total Cash, percent | .0 | .0 | .0 | .0 | .0 | .0 | .0 | .0 | .0 | .0 |
| Account Receivables | 64,008.0 | 86,348.0 | 101,985.0 | 100,314.0 | 101,244.0 | 113,657.4 | 127,531.7 | 143,099.5 | 160,567.8 | 180,168.4 |
| Account Receivables, % | 14.72 | 16.76 | 14.44 | 15.85 | 15.43 | 15.44 | 15.44 | 15.44 | 15.44 | 15.44 |
| Inventories | 18,358.0 | 21,942.0 | 37,549.0 | 30,609.0 | 28,248.0 | 33,771.9 | 37,894.5 | 42,520.3 | 47,710.8 | 53,534.9 |
| Inventories, % | 4.22 | 4.26 | 5.32 | 4.84 | 4.31 | 4.59 | 4.59 | 4.59 | 4.59 | 4.59 |
| Accounts Payable | 30,158.0 | 36,822.0 | 40,400.0 | 35,588.0 | 38,563.0 | 46,085.8 | 51,711.5 | 58,023.9 | 65,107.0 | 73,054.6 |
| Accounts Payable, % | 6.94 | 7.15 | 5.72 | 5.62 | 5.88 | 6.26 | 6.26 | 6.26 | 6.26 | 6.26 |
| Capital Expenditure | -34,305.0 | -39,032.0 | -39,729.0 | -37,535.0 | -44,243.0 | -49,708.9 | -55,776.9 | -62,585.7 | -70,225.5 | -78,798.0 |
| Capital Expenditure, % | -7.89 | -7.57 | -5.63 | -5.93 | -6.74 | -6.75 | -6.75 | -6.75 | -6.75 | -6.75 |
| Tax Rate, % | 32.38 | 32.38 | 32.38 | 32.38 | 32.38 | 32.38 | 32.38 | 32.38 | 32.38 | 32.38 |
| EBITAT | 9,071.5 | 15,984.5 | 34,401.1 | 27,875.9 | 26,178.8 | 27,063.1 | 30,366.7 | 34,073.6 | 38,233.0 | 42,900.1 |
| Depreciation | ||||||||||
| Changes in Account Receivables | ||||||||||
| Changes in Inventories | ||||||||||
| Changes in Accounts Payable | ||||||||||
| Capital Expenditure | ||||||||||
| UFCF | -39,599.5 | -5,784.5 | 4,048.1 | 32,669.9 | 24,296.8 | 15,389.4 | 16,582.9 | 18,607.1 | 20,878.5 | 23,427.2 |
| WACC, % | 3.96 | 4.03 | 4.02 | 3.99 | 3.99 | 4 | 4 | 4 | 4 | 4 |
| PV UFCF | ||||||||||
| SUM PV UFCF | 83,773.1 | |||||||||
| Long Term Growth Rate, % | 0.50 | |||||||||
| Free cash flow (T + 1) | 23,544 | |||||||||
| Terminal Value | 672,667 | |||||||||
| Present Terminal Value | 552,880 | |||||||||
| Enterprise Value | 636,653 | |||||||||
| Net Debt | 108,739 | |||||||||
| Equity Value | 527,914 | |||||||||
| Diluted Shares Outstanding, MM | 101 | |||||||||
| Equity Value Per Share | 5,221.90 |
What You Will Receive
- Comprehensive TOHO Gas Financials: Access to both historical and projected data for precise valuation.
- Customizable Parameters: Adjust WACC, tax rates, revenue growth, and capital expenditures according to your needs.
- Automated Calculations: Get dynamic calculations of intrinsic value and NPV.
- Scenario Simulation: Explore various scenarios to assess the future performance of Toho Gas Co., Ltd. (9533T).
- User-Friendly and Professional Design: Crafted for industry experts but easy for newcomers to navigate.
Key Features
- Genuine Toho Gas Financials: Gain access to precise pre-loaded historical data and future forecasts tailored for Toho Gas Co., Ltd. (9533T).
- Adjustable Forecast Parameters: Modify the highlighted fields for WACC, growth rates, and profit margins to suit your analysis.
- Real-Time Calculations: Experience automatic updates to Discounted Cash Flow (DCF), Net Present Value (NPV), and cash flow assessments.
- Interactive Dashboard: Utilize clear charts and summaries that make it easy to interpret your valuation outcomes.
- Designed for All Users: An intuitive layout crafted for investors, CFOs, and consultants, suitable for both novices and experts.
How It Functions
- 1. Access the Template: Download and launch the Excel file containing Toho Gas Co., Ltd. (9533T) preloaded data.
- 2. Adjust Key Assumptions: Modify essential inputs such as growth rates, WACC, and capital expenditures.
- 3. Instant Result Analysis: The DCF model automatically calculates the intrinsic value and NPV in real-time.
- 4. Explore Various Scenarios: Evaluate different forecasts to examine a range of valuation outcomes.
- 5. Present with Assurance: Share professional valuation insights to underpin your strategic decisions.
Why Opt for This Calculator for Toho Gas Co., Ltd. (9533T)?
- All-in-One Solution: Features DCF, WACC, and financial ratio analyses seamlessly integrated.
- Flexible Inputs: Modify the yellow-highlighted fields to explore different scenarios.
- In-Depth Analysis: Automatically computes Toho Gas's intrinsic value and Net Present Value.
- Preloaded Information: Access historical and projected data for precise calculations.
- High-Quality Standards: Perfect for financial analysts, investors, and business consultants alike.
Who Can Benefit from Toho Gas Co., Ltd. (9533T)?
- Investors: Make informed decisions leveraging a comprehensive valuation tool tailored for the energy sector.
- Financial Analysts: Enhance efficiency with a customizable DCF model designed specifically for utilities.
- Consultants: Quickly modify the template for impactful client presentations and detailed reports.
- Energy Enthusiasts: Expand your knowledge of valuation methodologies through real-world applications in the gas industry.
- Educators and Students: Utilize this resource as a practical tool for learning in finance and energy-related courses.
Contents of the Template
- Comprehensive DCF Model: An editable template featuring detailed valuation calculations.
- Real-World Data: Toho Gas Co., Ltd.'s (9533T) historical and projected financials are preloaded for in-depth analysis.
- Customizable Parameters: Modify WACC, growth rates, and tax assumptions to explore various scenarios.
- Financial Statements: Complete annual and quarterly breakdowns for enhanced insights.
- Key Ratios: Integrated analysis for assessing profitability, efficiency, and leverage.
- Dashboard with Visual Outputs: Visual aids such as charts and tables for clear, actionable insights.
Disclaimer
All information, articles, and product details provided on this website are for general informational and educational purposes only. We do not claim any ownership over, nor do we intend to infringe upon, any trademarks, copyrights, logos, brand names, or other intellectual property mentioned or depicted on this site. Such intellectual property remains the property of its respective owners, and any references here are made solely for identification or informational purposes, without implying any affiliation, endorsement, or partnership.
We make no representations or warranties, express or implied, regarding the accuracy, completeness, or suitability of any content or products presented. Nothing on this website should be construed as legal, tax, investment, financial, medical, or other professional advice. In addition, no part of this site—including articles or product references—constitutes a solicitation, recommendation, endorsement, advertisement, or offer to buy or sell any securities, franchises, or other financial instruments, particularly in jurisdictions where such activity would be unlawful.
All content is of a general nature and may not address the specific circumstances of any individual or entity. It is not a substitute for professional advice or services. Any actions you take based on the information provided here are strictly at your own risk. You accept full responsibility for any decisions or outcomes arising from your use of this website and agree to release us from any liability in connection with your use of, or reliance upon, the content or products found herein.