
|
DELE. Co., Ltd. (9603.T) Avaliação DCF |
Totalmente Editável: Adapte-Se Às Suas Necessidades No Excel Ou Planilhas
Design Profissional: Modelos Confiáveis E Padrão Da Indústria
Pré-Construídos Para Uso Rápido E Eficiente
Compatível com MAC/PC, totalmente desbloqueado
Não É Necessária Experiência; Fácil De Seguir
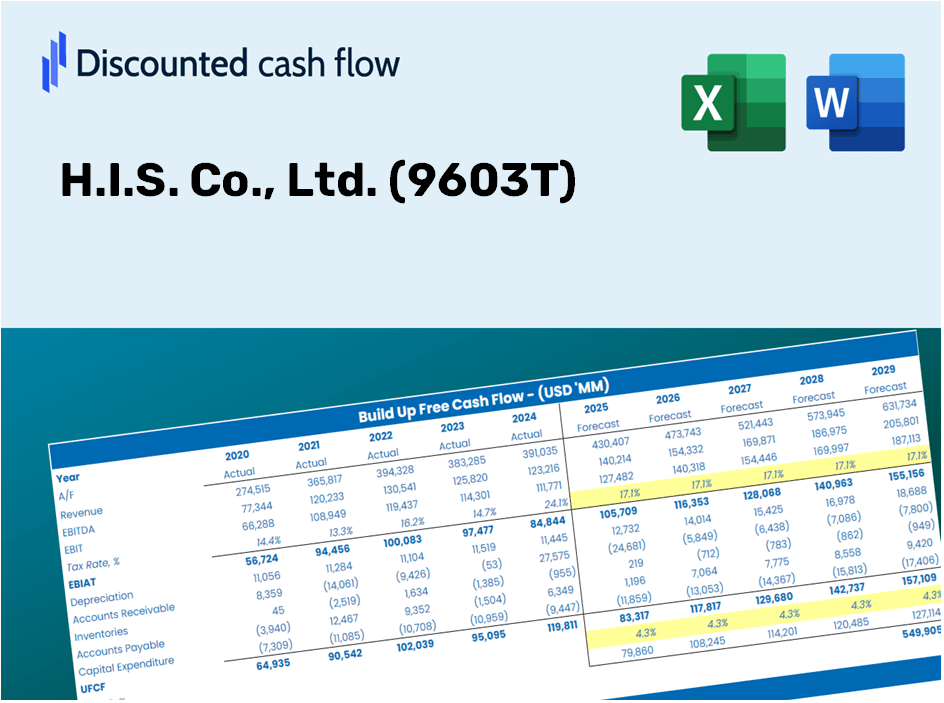
H.I.S. Co., Ltd. (9603.T) Bundle
Simplifique sua análise e aumente a precisão com a nossa calculadora DCF (9603T)! Equipado com H.I.S. autêntico Co., Ltd. Dados e suposições personalizáveis, essa ferramenta o capacita a prever, avaliar e valorizar H.I.S. Co., Ltd. Como um investidor experiente.
Discounted Cash Flow (DCF) - (USD MM)
| Year | AY1 2020 |
AY2 2021 |
AY3 2022 |
AY4 2023 |
AY5 2024 |
FY1 2025 |
FY2 2026 |
FY3 2027 |
FY4 2028 |
FY5 2029 |
|---|---|---|---|---|---|---|---|---|---|---|
| Revenue | 430,284.0 | 118,563.0 | 142,794.0 | 251,866.0 | 343,334.0 | 360,816.4 | 379,189.0 | 398,497.1 | 418,788.4 | 440,112.9 |
| Revenue Growth, % | 0 | -72.45 | 20.44 | 76.38 | 36.32 | 5.09 | 5.09 | 5.09 | 5.09 | 5.09 |
| EBITDA | -18,323.0 | -36,421.0 | 6,949.0 | 11,946.0 | 22,366.0 | -13,605.1 | -14,297.9 | -15,025.9 | -15,791.0 | -16,595.1 |
| EBITDA, % | -4.26 | -30.72 | 4.87 | 4.74 | 6.51 | -3.77 | -3.77 | -3.77 | -3.77 | -3.77 |
| Depreciation | 13,682.0 | 13,410.0 | 13,173.0 | 11,012.0 | 11,366.0 | 22,657.8 | 23,811.6 | 25,024.0 | 26,298.3 | 27,637.4 |
| Depreciation, % | 3.18 | 11.31 | 9.23 | 4.37 | 3.31 | 6.28 | 6.28 | 6.28 | 6.28 | 6.28 |
| EBIT | -32,005.0 | -49,831.0 | -6,224.0 | 934.0 | 11,000.0 | -36,263.0 | -38,109.5 | -40,050.0 | -42,089.3 | -44,232.5 |
| EBIT, % | -7.44 | -42.03 | -4.36 | 0.37083 | 3.2 | -10.05 | -10.05 | -10.05 | -10.05 | -10.05 |
| Total Cash | 95,234.0 | 101,422.0 | 145,007.0 | 157,594.0 | 138,167.0 | 224,058.9 | 235,467.9 | 247,457.8 | 260,058.3 | 273,300.3 |
| Total Cash, percent | .0 | .0 | .0 | .0 | .0 | .0 | .0 | .0 | .0 | .0 |
| Account Receivables | 27,474.0 | 14,655.0 | 29,773.0 | 43,561.0 | 45,025.0 | 50,518.1 | 53,090.5 | 55,793.8 | 58,634.8 | 61,620.5 |
| Account Receivables, % | 6.39 | 12.36 | 20.85 | 17.3 | 13.11 | 14 | 14 | 14 | 14 | 14 |
| Inventories | .0 | .0 | .0 | .0 | .0 | .0 | .0 | .0 | .0 | .0 |
| Inventories, % | 0 | 0 | 0 | 0 | 0 | 0 | 0 | 0 | 0 | 0 |
| Accounts Payable | 9,029.0 | 12,978.0 | 6,698.0 | 10,122.0 | 12,441.0 | 18,313.3 | 19,245.8 | 20,225.7 | 21,255.6 | 22,338.0 |
| Accounts Payable, % | 2.1 | 10.95 | 4.69 | 4.02 | 3.62 | 5.08 | 5.08 | 5.08 | 5.08 | 5.08 |
| Capital Expenditure | -66,565.0 | -16,567.0 | -8,912.0 | -6,487.0 | -8,196.0 | -29,332.3 | -30,825.9 | -32,395.5 | -34,045.1 | -35,778.6 |
| Capital Expenditure, % | -15.47 | -13.97 | -6.24 | -2.58 | -2.39 | -8.13 | -8.13 | -8.13 | -8.13 | -8.13 |
| Tax Rate, % | -2.24 | -2.24 | -2.24 | -2.24 | -2.24 | -2.24 | -2.24 | -2.24 | -2.24 | -2.24 |
| EBITAT | -24,208.0 | -48,895.1 | -6,817.4 | 1,898.5 | 11,246.4 | -34,359.9 | -36,109.5 | -37,948.1 | -39,880.4 | -41,911.1 |
| Depreciation | ||||||||||
| Changes in Account Receivables | ||||||||||
| Changes in Inventories | ||||||||||
| Changes in Accounts Payable | ||||||||||
| Capital Expenditure | ||||||||||
| UFCF | -95,536.0 | -35,284.1 | -23,954.4 | -3,940.5 | 15,271.4 | -40,655.2 | -44,763.6 | -47,043.0 | -49,438.4 | -51,955.7 |
| WACC, % | 4.19 | 4.73 | 4.78 | 4.78 | 4.78 | 4.65 | 4.65 | 4.65 | 4.65 | 4.65 |
| PV UFCF | ||||||||||
| SUM PV UFCF | -203,381.9 | |||||||||
| Long Term Growth Rate, % | 3.00 | |||||||||
| Free cash flow (T + 1) | -53,514 | |||||||||
| Terminal Value | -3,242,890 | |||||||||
| Present Terminal Value | -2,583,638 | |||||||||
| Enterprise Value | -2,787,020 | |||||||||
| Net Debt | 73,718 | |||||||||
| Equity Value | -2,860,738 | |||||||||
| Diluted Shares Outstanding, MM | 79 | |||||||||
| Equity Value Per Share | -36,030.81 |
What You Will Receive
- Customizable Forecast Inputs: Easily modify key assumptions (growth %, margins, WACC) to explore various scenarios.
- Industry-Specific Data: H.I.S. Co., Ltd. (9603T) financial data pre-loaded to facilitate your analysis.
- Automated DCF Calculations: The template computes Net Present Value (NPV) and intrinsic value effortlessly.
- Professional and Adaptable: A refined Excel model tailored to your valuation requirements.
- Designed for Analysts and Investors: Perfect for assessing projections, validating strategies, and optimizing your time.
Key Features
- Pre-Loaded Data: H.I.S. Co., Ltd. (9603T) historical financial statements and pre-filled forecasts.
- Fully Adjustable Inputs: Modify WACC, tax rates, revenue growth, and EBITDA margins as needed.
- Instant Results: View the intrinsic value of H.I.S. Co., Ltd. (9603T) recalculating in real time.
- Clear Visual Outputs: Dashboard charts present valuation results and key metrics clearly.
- Built for Accuracy: A professional-grade tool designed for analysts, investors, and finance professionals.
How It Works
- Step 1: Download the Excel file.
- Step 2: Review pre-filled H.I.S. Co., Ltd. (9603T) data (historical and projected).
- Step 3: Modify key assumptions (highlighted in yellow) based on your insights.
- Step 4: Observe automatic recalculations for H.I.S. Co., Ltd.'s intrinsic value.
- Step 5: Utilize the results for making investment decisions or for reporting purposes.
Why Select This Calculator for H.I.S. Co., Ltd. (9603T)?
- Reliable Data: Utilize authentic H.I.S. financial metrics for trustworthy valuation outcomes.
- Customizable Options: Modify essential inputs such as growth rates, WACC, and tax rates to align with your forecasts.
- Efficient: Built-in calculations save you the hassle of starting from square one.
- Professional Quality: Tailored for investors, analysts, and advisors.
- User-Friendly Design: Easy-to-navigate interface and clear instructions cater to all skill levels.
Who Can Benefit from H.I.S. Co., Ltd. (9603T)?
- Investors: Assess H.I.S. Co., Ltd.'s valuation prior to making investment decisions.
- CFOs and Financial Analysts: Enhance valuation workflows and validate financial forecasts.
- Startup Founders: Gain insight into how established companies like H.I.S. Co., Ltd. are appraised.
- Consultants: Create comprehensive valuation reports for your clientele.
- Students and Educators: Utilize actual market data to practice and demonstrate valuation methodologies.
Contents of the Template
- Pre-Filled DCF Model: H.I.S. Co., Ltd.’s financial data preloaded for immediate application.
- WACC Calculator: Comprehensive calculations for Weighted Average Cost of Capital.
- Financial Ratios: Assess H.I.S. Co., Ltd.'s profitability, leverage, and operational efficiency.
- Editable Inputs: Modify assumptions like growth rates, margins, and CAPEX to suit your scenarios.
- Financial Statements: Access annual and quarterly reports for in-depth analysis.
- Interactive Dashboard: Effortlessly visualize essential valuation metrics and results.
Disclaimer
All information, articles, and product details provided on this website are for general informational and educational purposes only. We do not claim any ownership over, nor do we intend to infringe upon, any trademarks, copyrights, logos, brand names, or other intellectual property mentioned or depicted on this site. Such intellectual property remains the property of its respective owners, and any references here are made solely for identification or informational purposes, without implying any affiliation, endorsement, or partnership.
We make no representations or warranties, express or implied, regarding the accuracy, completeness, or suitability of any content or products presented. Nothing on this website should be construed as legal, tax, investment, financial, medical, or other professional advice. In addition, no part of this site—including articles or product references—constitutes a solicitation, recommendation, endorsement, advertisement, or offer to buy or sell any securities, franchises, or other financial instruments, particularly in jurisdictions where such activity would be unlawful.
All content is of a general nature and may not address the specific circumstances of any individual or entity. It is not a substitute for professional advice or services. Any actions you take based on the information provided here are strictly at your own risk. You accept full responsibility for any decisions or outcomes arising from your use of this website and agree to release us from any liability in connection with your use of, or reliance upon, the content or products found herein.