
|
NTT Data Corporation (9613.T) Avaliação DCF |
Totalmente Editável: Adapte-Se Às Suas Necessidades No Excel Ou Planilhas
Design Profissional: Modelos Confiáveis E Padrão Da Indústria
Pré-Construídos Para Uso Rápido E Eficiente
Compatível com MAC/PC, totalmente desbloqueado
Não É Necessária Experiência; Fácil De Seguir
NTT DATA Corporation (9613.T) Bundle
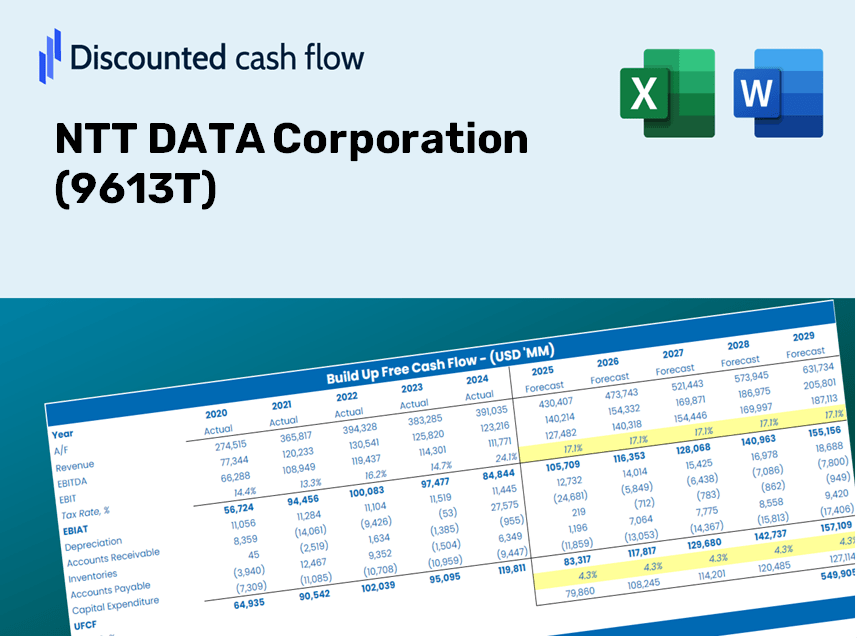
Ganhe domínio sobre sua análise de avaliação da NTT Data Corporation (9613T) usando nossa sofisticada calculadora DCF! Este modelo do Excel é pré -carregado com dados autênticos (9613T), permitindo que você ajuste as previsões e suposições para determinar com precisão o valor intrínseco da NTT Data Corporation.
Benefits of Choosing NTT DATA Corporation (9613T)
- Comprehensive Financial Overview: Access to both historical and projected financial data for precise valuation.
- Customizable Parameters: Adjust factors such as WACC, tax rates, revenue growth, and capital expenditures to fit your analysis.
- Dynamic Calculations: Immediate computation of intrinsic value and NPV for real-time insights.
- Scenario Simulation: Evaluate a variety of scenarios to assess NTT DATA's potential future performance.
- User-Friendly Interface: Designed for industry experts while remaining approachable for newcomers.
Key Features
- Real-Life NTT DATA Data: Pre-filled with NTT DATA Corporation's historical financials and future projections.
- Fully Customizable Inputs: Modify revenue growth rates, profit margins, weighted average cost of capital (WACC), tax rates, and capital expenditures.
- Dynamic Valuation Model: Automatically updates Net Present Value (NPV) and intrinsic value based on your customized inputs.
- Scenario Testing: Develop multiple forecasting scenarios to explore various valuation outcomes.
- User-Friendly Design: Intuitive and structured for both professionals and newcomers.
How It Functions
- Step 1: Download the Excel spreadsheet.
- Step 2: Review the pre-filled NTT DATA Corporation (9613T) data (historical and forecasted).
- Step 3: Modify key assumptions (yellow-highlighted cells) according to your analysis.
- Step 4: Observe automatic recalculations for NTT DATA Corporation’s (9613T) intrinsic value.
- Step 5: Utilize the results for investment decisions or reporting purposes.
Why Opt for This Calculator?
- Precision: Utilizes real NTT DATA Corporation (9613T) financials for reliable data.
- Adaptability: Built for users to comfortably experiment with and adjust inputs.
- Efficiency: Avoid the complexities of starting a DCF model from ground zero.
- Professional Quality: Crafted with the accuracy and usability expected by CFOs.
- Intuitive: Simple to navigate, making it accessible for users without extensive financial modeling skills.
Who Should Use This Product?
- Finance Students: Master valuation techniques and apply them with real-world data.
- Academics: Integrate professional valuation models into your coursework or research projects.
- Investors: Validate your investment assumptions and assess valuation scenarios for NTT DATA Corporation (9613T).
- Analysts: Enhance your efficiency with a customizable, pre-designed DCF model.
- Small Business Owners: Discover how large publicly traded companies like NTT DATA Corporation (9613T) are analyzed in the market.
Contents of the Template
- Operating and Balance Sheet Data: Pre-populated historical data and forecasts for NTT DATA Corporation (9613T), covering metrics such as revenue, EBITDA, EBIT, and capital expenditures.
- WACC Calculation: A dedicated worksheet for calculating the Weighted Average Cost of Capital (WACC), featuring essential parameters like Beta, risk-free rate, and share price.
- DCF Valuation (Unlevered and Levered): Customizable Discounted Cash Flow models that present intrinsic value along with comprehensive calculations.
- Financial Statements: Pre-loaded annual and quarterly financial statements for NTT DATA Corporation (9613T) to facilitate thorough analysis.
- Key Ratios: A set of profitability, leverage, and efficiency ratios specific to NTT DATA Corporation (9613T).
- Dashboard and Charts: An intuitive visual summary of valuation outputs and assumptions, simplifying the analysis of results.
Disclaimer
All information, articles, and product details provided on this website are for general informational and educational purposes only. We do not claim any ownership over, nor do we intend to infringe upon, any trademarks, copyrights, logos, brand names, or other intellectual property mentioned or depicted on this site. Such intellectual property remains the property of its respective owners, and any references here are made solely for identification or informational purposes, without implying any affiliation, endorsement, or partnership.
We make no representations or warranties, express or implied, regarding the accuracy, completeness, or suitability of any content or products presented. Nothing on this website should be construed as legal, tax, investment, financial, medical, or other professional advice. In addition, no part of this site—including articles or product references—constitutes a solicitation, recommendation, endorsement, advertisement, or offer to buy or sell any securities, franchises, or other financial instruments, particularly in jurisdictions where such activity would be unlawful.
All content is of a general nature and may not address the specific circumstances of any individual or entity. It is not a substitute for professional advice or services. Any actions you take based on the information provided here are strictly at your own risk. You accept full responsibility for any decisions or outcomes arising from your use of this website and agree to release us from any liability in connection with your use of, or reliance upon, the content or products found herein.