
|
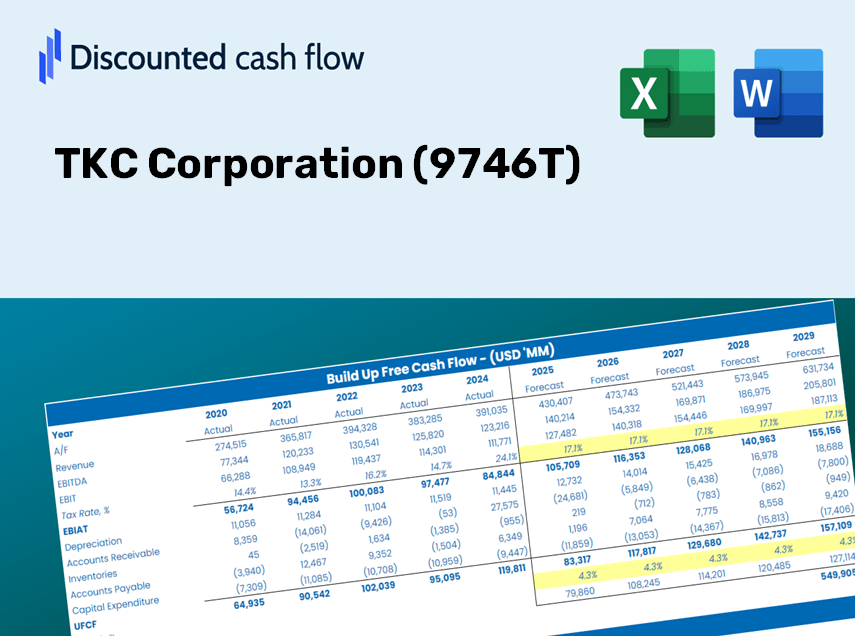
TKC Corporation (9746.T) Avaliação DCF |
Totalmente Editável: Adapte-Se Às Suas Necessidades No Excel Ou Planilhas
Design Profissional: Modelos Confiáveis E Padrão Da Indústria
Pré-Construídos Para Uso Rápido E Eficiente
Compatível com MAC/PC, totalmente desbloqueado
Não É Necessária Experiência; Fácil De Seguir
TKC Corporation (9746.T) Bundle
Descubra o verdadeiro potencial da TKC Corporation (9746T) com nossa calculadora DCF avançada! Ajuste as principais suposições, explore vários cenários e avalie os efeitos das alterações na avaliação da corporação TKC (9746T) - tudo dentro de um único modelo do Excel.
Discounted Cash Flow (DCF) - (USD MM)
| Year | AY1 2020 |
AY2 2021 |
AY3 2022 |
AY4 2023 |
AY5 2024 |
FY1 2025 |
FY2 2026 |
FY3 2027 |
FY4 2028 |
FY5 2029 |
|---|---|---|---|---|---|---|---|---|---|---|
| Revenue | 67,814.0 | 66,221.0 | 67,838.0 | 71,915.0 | 75,219.0 | 77,230.5 | 79,295.9 | 81,416.4 | 83,593.7 | 85,829.2 |
| Revenue Growth, % | 0 | -2.35 | 2.44 | 6.01 | 4.59 | 2.67 | 2.67 | 2.67 | 2.67 | 2.67 |
| EBITDA | 14,451.0 | 15,603.0 | 16,698.0 | 18,667.0 | 19,526.0 | 18,751.9 | 19,253.4 | 19,768.3 | 20,296.9 | 20,839.7 |
| EBITDA, % | 21.31 | 23.56 | 24.61 | 25.96 | 25.96 | 24.28 | 24.28 | 24.28 | 24.28 | 24.28 |
| Depreciation | 3,070.0 | 2,945.0 | 3,050.0 | 3,533.0 | 3,517.0 | 3,561.7 | 3,656.9 | 3,754.7 | 3,855.1 | 3,958.2 |
| Depreciation, % | 4.53 | 4.45 | 4.5 | 4.91 | 4.68 | 4.61 | 4.61 | 4.61 | 4.61 | 4.61 |
| EBIT | 11,381.0 | 12,658.0 | 13,648.0 | 15,134.0 | 16,009.0 | 15,190.2 | 15,596.5 | 16,013.5 | 16,441.8 | 16,881.5 |
| EBIT, % | 16.78 | 19.11 | 20.12 | 21.04 | 21.28 | 19.67 | 19.67 | 19.67 | 19.67 | 19.67 |
| Total Cash | 27,201.0 | 26,426.0 | 29,920.0 | 32,093.0 | 33,734.0 | 32,992.3 | 33,874.6 | 34,780.5 | 35,710.6 | 36,665.6 |
| Total Cash, percent | .0 | .0 | .0 | .0 | .0 | .0 | .0 | .0 | .0 | .0 |
| Account Receivables | 7,427.0 | 7,343.0 | 8,278.0 | 8,818.0 | 10,038.0 | 9,244.5 | 9,491.7 | 9,745.5 | 10,006.2 | 10,273.8 |
| Account Receivables, % | 10.95 | 11.09 | 12.2 | 12.26 | 13.35 | 11.97 | 11.97 | 11.97 | 11.97 | 11.97 |
| Inventories | 722.0 | 411.0 | 493.0 | 424.0 | 541.0 | 574.7 | 590.1 | 605.9 | 622.1 | 638.7 |
| Inventories, % | 1.06 | 0.62065 | 0.72673 | 0.58958 | 0.71923 | 0.74418 | 0.74418 | 0.74418 | 0.74418 | 0.74418 |
| Accounts Payable | 2,181.0 | 2,402.0 | 2,973.0 | 2,698.0 | 3,863.0 | 3,106.7 | 3,189.8 | 3,275.1 | 3,362.7 | 3,452.6 |
| Accounts Payable, % | 3.22 | 3.63 | 4.38 | 3.75 | 5.14 | 4.02 | 4.02 | 4.02 | 4.02 | 4.02 |
| Capital Expenditure | -3,107.0 | -3,307.0 | -3,333.0 | -4,790.0 | -5,516.0 | -4,399.5 | -4,517.1 | -4,637.9 | -4,761.9 | -4,889.3 |
| Capital Expenditure, % | -4.58 | -4.99 | -4.91 | -6.66 | -7.33 | -5.7 | -5.7 | -5.7 | -5.7 | -5.7 |
| Tax Rate, % | 29.58 | 29.58 | 29.58 | 29.58 | 29.58 | 29.58 | 29.58 | 29.58 | 29.58 | 29.58 |
| EBITAT | 7,643.0 | 8,684.6 | 9,315.6 | 10,825.3 | 11,274.0 | 10,510.9 | 10,792.0 | 11,080.6 | 11,376.9 | 11,681.1 |
| Depreciation | ||||||||||
| Changes in Account Receivables | ||||||||||
| Changes in Inventories | ||||||||||
| Changes in Accounts Payable | ||||||||||
| Capital Expenditure | ||||||||||
| UFCF | 1,638.0 | 8,938.6 | 8,586.6 | 8,822.3 | 9,103.0 | 9,676.6 | 9,752.3 | 10,013.1 | 10,280.8 | 10,555.8 |
| WACC, % | 6.72 | 6.72 | 6.72 | 6.72 | 6.72 | 6.72 | 6.72 | 6.72 | 6.72 | 6.72 |
| PV UFCF | ||||||||||
| SUM PV UFCF | 41,424.6 | |||||||||
| Long Term Growth Rate, % | 2.00 | |||||||||
| Free cash flow (T + 1) | 10,767 | |||||||||
| Terminal Value | 228,333 | |||||||||
| Present Terminal Value | 164,981 | |||||||||
| Enterprise Value | 206,405 | |||||||||
| Net Debt | -33,226 | |||||||||
| Equity Value | 239,631 | |||||||||
| Diluted Shares Outstanding, MM | 52 | |||||||||
| Equity Value Per Share | 4,595.30 |
Benefits You Will Receive
- Adjustable Forecast Parameters: Easily modify key assumptions (growth %, margins, WACC) to explore various scenarios.
- Relevant Market Data: Pre-loaded financial information for TKC Corporation (9746T) to enhance your analysis.
- Instant DCF Results: The template automatically computes the Net Present Value (NPV) and intrinsic value for your convenience.
- Tailored and Professional Design: A sleek Excel model that can be customized to fit your valuation requirements.
- Designed for Analysts and Investors: Perfect for evaluating forecasts, confirming strategies, and improving efficiency.
Key Features
- Authentic Financial Data for TKC Corporation: Gain access to precise pre-loaded historical figures and future forecasts.
- Adjustable Forecast Parameters: Modify the yellow-highlighted fields such as WACC, growth rates, and profit margins.
- Real-Time Calculations: Instant updates to DCF, Net Present Value (NPV), and cash flow analyses.
- User-Friendly Visual Dashboard: Intuitive charts and summaries to help you visualize your valuation outcomes.
- Designed for All Skill Levels: A straightforward, easy-to-navigate layout tailored for investors, CFOs, and consultants alike.
How It Works
- 1. Access the Template: Download and open the Excel file featuring TKC Corporation’s (9746T) preloaded data.
- 2. Modify Assumptions: Update essential inputs such as growth rates, WACC, and capital expenditures.
- 3. View Instant Results: The DCF model automatically calculates the intrinsic value and NPV.
- 4. Evaluate Scenarios: Run various forecasts to explore different valuation results.
- 5. Present with Confidence: Deliver professional valuation insights to enhance your decision-making process.
Why Select This Calculator for TKC Corporation (9746T)?
- Designed for Experts: A sophisticated tool utilized by finance professionals, analysts, and consultants.
- Accurate Data: Historical and projected financials for TKC Corporation preloaded to ensure precision.
- Flexible Scenario Analysis: Effortlessly test various forecasts and assumptions.
- Concise Results: Automatically computes intrinsic value, NPV, and other essential metrics.
- User-Friendly: Step-by-step guidance simplifies the entire process.
Who Can Benefit from TKC Corporation (9746T)?
- Investors: Gain clarity and confidence in your investment choices with our high-quality valuation tool.
- Financial Analysts: Streamline your workflow with an easily customizable DCF model that’s ready to use.
- Consultants: Effortlessly tailor the template for impactful client presentations and detailed reports.
- Finance Enthusiasts: Enhance your knowledge of valuation methods through real-world case studies and examples.
- Educators and Students: Leverage this resource as a hands-on learning aid in finance-related curricula.
What the Template Contains
- Operating and Balance Sheet Data: Pre-filled TKC Corporation historical data and forecasts, including revenue, EBITDA, EBIT, and capital expenditures.
- WACC Calculation: A dedicated sheet for Weighted Average Cost of Capital (WACC), featuring parameters like Beta, risk-free rate, and share price.
- DCF Valuation (Unlevered and Levered): Customizable Discounted Cash Flow models displaying intrinsic value with thorough calculations.
- Financial Statements: Pre-loaded financial statements (annual and quarterly) to facilitate analysis.
- Key Ratios: Incorporates profitability, leverage, and efficiency ratios for TKC Corporation.
- Dashboard and Charts: Visual summary of valuation outputs and assumptions for easy analysis of results.
Disclaimer
All information, articles, and product details provided on this website are for general informational and educational purposes only. We do not claim any ownership over, nor do we intend to infringe upon, any trademarks, copyrights, logos, brand names, or other intellectual property mentioned or depicted on this site. Such intellectual property remains the property of its respective owners, and any references here are made solely for identification or informational purposes, without implying any affiliation, endorsement, or partnership.
We make no representations or warranties, express or implied, regarding the accuracy, completeness, or suitability of any content or products presented. Nothing on this website should be construed as legal, tax, investment, financial, medical, or other professional advice. In addition, no part of this site—including articles or product references—constitutes a solicitation, recommendation, endorsement, advertisement, or offer to buy or sell any securities, franchises, or other financial instruments, particularly in jurisdictions where such activity would be unlawful.
All content is of a general nature and may not address the specific circumstances of any individual or entity. It is not a substitute for professional advice or services. Any actions you take based on the information provided here are strictly at your own risk. You accept full responsibility for any decisions or outcomes arising from your use of this website and agree to release us from any liability in connection with your use of, or reliance upon, the content or products found herein.