
|
Funai Soken Holdings Incorporated (9757.T) Avaliação DCF |
Totalmente Editável: Adapte-Se Às Suas Necessidades No Excel Ou Planilhas
Design Profissional: Modelos Confiáveis E Padrão Da Indústria
Pré-Construídos Para Uso Rápido E Eficiente
Compatível com MAC/PC, totalmente desbloqueado
Não É Necessária Experiência; Fácil De Seguir
Funai Soken Holdings Incorporated (9757.T) Bundle
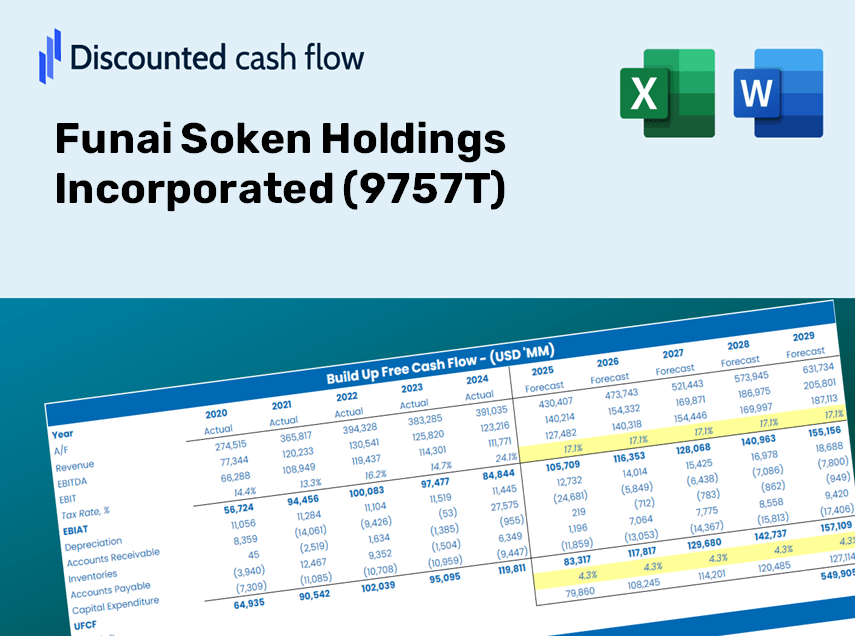
Desbloqueie o verdadeiro valor da Funai Soken Holdings Incorporated com nossa calculadora DCF de nível profissional! Modifique as principais suposições, teste vários cenários e analise como as mudanças afetam a avaliação da Funai Soken Holdings Incorporated - tudo dentro de um único modelo do Excel.
Benefits You Will Receive
- Pre-Loaded Financial Model: Funai Soken’s actual data allows for an accurate DCF valuation.
- Comprehensive Forecast Control: Modify revenue growth, margins, WACC, and other critical factors.
- Real-Time Calculations: Updates occur automatically, providing immediate results as you adjust inputs.
- Professional-Grade Template: An enhanced Excel file tailored for high-quality valuation submissions.
- Flexible and Reusable: Designed for adaptability, ideal for ongoing detailed forecasts.
Key Features
- 🔍 Real-Time [Symbol] Financial Data: Pre-populated historical and projected financial metrics for Funai Soken Holdings Incorporated.
- ✏️ Fully Adjustable Inputs: Tailor all essential parameters (yellow cells) including WACC, growth %, and tax rates.
- 📊 Comprehensive DCF Valuation: Integrated formulas assess Funai Soken’s intrinsic value through the Discounted Cash Flow analysis.
- ⚡ Immediate Feedback: Visualize Funai Soken’s valuation instantly following any adjustments.
- Scenario Analysis: Evaluate and contrast potential outcomes based on varying financial assumptions side-by-side.
How It Works
- Step 1: Download the Excel file for Funai Soken Holdings Incorporated (9757T).
- Step 2: Examine the pre-filled financial data and forecasts provided for Funai Soken Holdings Incorporated (9757T).
- Step 3: Adjust key inputs such as revenue growth, WACC, and tax rates (marked cells).
- Step 4: Observe the DCF model refresh immediately as you change your assumptions.
- Step 5: Review the results and utilize them for informed investment decisions regarding Funai Soken Holdings Incorporated (9757T).
Why Opt for This Calculator?
- User-Friendly Interface: Tailored for both novices and seasoned professionals.
- Customizable Parameters: Effortlessly tweak inputs to suit your analysis.
- Real-Time Feedback: Instantly view changes to Funai Soken Holdings’ valuation as you adjust different variables.
- Preconfigured Data: Comes loaded with Funai Soken Holdings’ actual financial metrics for swift evaluations.
- Relied Upon by Experts: Employed by investors and analysts for making well-informed choices.
Who Can Benefit from This Product?
- Professional Investors: Create comprehensive and trustworthy valuation models for portfolio assessment.
- Corporate Finance Teams: Evaluate valuation scenarios to inform strategic decision-making within the company.
- Consultants and Advisors: Deliver precise valuation insights for Funai Soken Holdings Incorporated (9757T) to clients.
- Students and Educators: Utilize real-world data for hands-on experience in financial modeling and teaching.
- Tech Enthusiasts: Gain insights into the valuation processes of technology companies like Funai Soken Holdings Incorporated (9757T).
What the Template Contains
- Historical Data: Encompasses Funai Soken Holdings Incorporated's (9757T) past financials and foundational forecasts.
- DCF and Levered DCF Models: Comprehensive templates designed to calculate the intrinsic value of Funai Soken Holdings Incorporated (9757T).
- WACC Sheet: Ready-to-use calculations for the Weighted Average Cost of Capital.
- Editable Inputs: Customize key drivers such as growth rates, EBITDA %, and CAPEX assumptions.
- Quarterly and Annual Statements: A thorough analysis of Funai Soken Holdings Incorporated's (9757T) financials.
- Interactive Dashboard: A dynamic interface to visualize valuation results and projections.
Disclaimer
All information, articles, and product details provided on this website are for general informational and educational purposes only. We do not claim any ownership over, nor do we intend to infringe upon, any trademarks, copyrights, logos, brand names, or other intellectual property mentioned or depicted on this site. Such intellectual property remains the property of its respective owners, and any references here are made solely for identification or informational purposes, without implying any affiliation, endorsement, or partnership.
We make no representations or warranties, express or implied, regarding the accuracy, completeness, or suitability of any content or products presented. Nothing on this website should be construed as legal, tax, investment, financial, medical, or other professional advice. In addition, no part of this site—including articles or product references—constitutes a solicitation, recommendation, endorsement, advertisement, or offer to buy or sell any securities, franchises, or other financial instruments, particularly in jurisdictions where such activity would be unlawful.
All content is of a general nature and may not address the specific circumstances of any individual or entity. It is not a substitute for professional advice or services. Any actions you take based on the information provided here are strictly at your own risk. You accept full responsibility for any decisions or outcomes arising from your use of this website and agree to release us from any liability in connection with your use of, or reliance upon, the content or products found herein.