
|
Kato Sangyo Co., Ltd. (9869.T) Avaliação DCF |
Totalmente Editável: Adapte-Se Às Suas Necessidades No Excel Ou Planilhas
Design Profissional: Modelos Confiáveis E Padrão Da Indústria
Pré-Construídos Para Uso Rápido E Eficiente
Compatível com MAC/PC, totalmente desbloqueado
Não É Necessária Experiência; Fácil De Seguir
Kato Sangyo Co., Ltd. (9869.T) Bundle
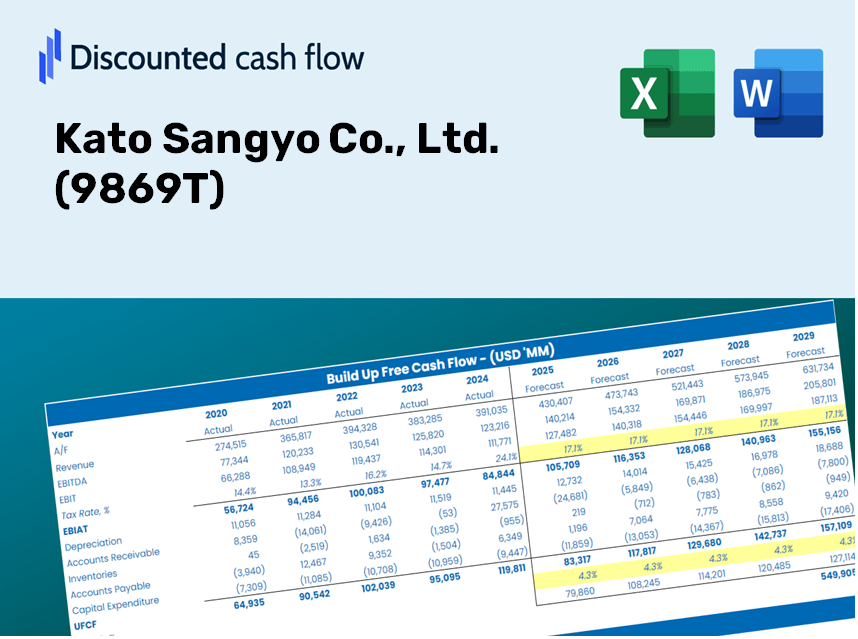
Seja você um investidor ou analista, esta calculadora DCF (9869T) é o seu recurso preferido para uma avaliação precisa. Embalado com dados reais da Kato Sangyo Co., Ltd., você pode ajustar as previsões e observar os efeitos em tempo real.
Discounted Cash Flow (DCF) - (USD MM)
| Year | AY1 2020 |
AY2 2021 |
AY3 2022 |
AY4 2023 |
AY5 2024 |
FY1 2025 |
FY2 2026 |
FY3 2027 |
FY4 2028 |
FY5 2029 |
|---|---|---|---|---|---|---|---|---|---|---|
| Revenue | 1,104,695.0 | 1,137,101.0 | 1,035,663.0 | 1,099,391.0 | 1,169,833.0 | 1,082,884.6 | 1,002,398.6 | 927,894.8 | 858,928.6 | 795,088.3 |
| Revenue Growth, % | 0 | 2.93 | -8.92 | 6.15 | 6.41 | -7.43 | -7.43 | -7.43 | -7.43 | -7.43 |
| EBITDA | 18,120.0 | 17,763.0 | 18,271.0 | 23,978.0 | 29,579.0 | 20,956.2 | 19,398.6 | 17,956.8 | 16,622.1 | 15,386.7 |
| EBITDA, % | 1.64 | 1.56 | 1.76 | 2.18 | 2.53 | 1.94 | 1.94 | 1.94 | 1.94 | 1.94 |
| Depreciation | 4,353.0 | 4,758.0 | 4,931.0 | 4,943.0 | 5,924.0 | 4,861.3 | 4,500.0 | 4,165.5 | 3,855.9 | 3,569.3 |
| Depreciation, % | 0.39405 | 0.41843 | 0.47612 | 0.44961 | 0.5064 | 0.44892 | 0.44892 | 0.44892 | 0.44892 | 0.44892 |
| EBIT | 13,767.0 | 13,005.0 | 13,340.0 | 19,035.0 | 23,655.0 | 16,094.9 | 14,898.6 | 13,791.3 | 12,766.2 | 11,817.4 |
| EBIT, % | 1.25 | 1.14 | 1.29 | 1.73 | 2.02 | 1.49 | 1.49 | 1.49 | 1.49 | 1.49 |
| Total Cash | 85,910.0 | 82,934.0 | 84,631.0 | 85,045.0 | 92,064.0 | 84,134.6 | 77,881.2 | 72,092.7 | 66,734.3 | 61,774.3 |
| Total Cash, percent | .0 | .0 | .0 | .0 | .0 | .0 | .0 | .0 | .0 | .0 |
| Account Receivables | 130,481.0 | 136,856.0 | 150,499.0 | 184,763.0 | 168,690.0 | 150,747.5 | 139,543.1 | 129,171.5 | 119,570.8 | 110,683.6 |
| Account Receivables, % | 11.81 | 12.04 | 14.53 | 16.81 | 14.42 | 13.92 | 13.92 | 13.92 | 13.92 | 13.92 |
| Inventories | 24,684.0 | 27,401.0 | 29,538.0 | 33,644.0 | 37,317.0 | 29,771.6 | 27,558.9 | 25,510.5 | 23,614.4 | 21,859.3 |
| Inventories, % | 2.23 | 2.41 | 2.85 | 3.06 | 3.19 | 2.75 | 2.75 | 2.75 | 2.75 | 2.75 |
| Accounts Payable | 196,160.0 | 202,960.0 | 212,314.0 | 246,559.0 | 237,965.0 | 214,140.0 | 198,223.9 | 183,490.8 | 169,852.8 | 157,228.4 |
| Accounts Payable, % | 17.76 | 17.85 | 20.5 | 22.43 | 20.34 | 19.77 | 19.77 | 19.77 | 19.77 | 19.77 |
| Capital Expenditure | -5,333.0 | -6,996.0 | -4,985.0 | -8,371.0 | -8,733.0 | -6,686.3 | -6,189.4 | -5,729.3 | -5,303.5 | -4,909.3 |
| Capital Expenditure, % | -0.48276 | -0.61525 | -0.48133 | -0.76142 | -0.74652 | -0.61746 | -0.61746 | -0.61746 | -0.61746 | -0.61746 |
| Tax Rate, % | 38.07 | 38.07 | 38.07 | 38.07 | 38.07 | 38.07 | 38.07 | 38.07 | 38.07 | 38.07 |
| EBITAT | 9,117.9 | 8,455.9 | 8,721.1 | 12,146.2 | 14,650.4 | 10,377.0 | 9,605.7 | 8,891.8 | 8,230.9 | 7,619.1 |
| Depreciation | ||||||||||
| Changes in Account Receivables | ||||||||||
| Changes in Inventories | ||||||||||
| Changes in Accounts Payable | ||||||||||
| Capital Expenditure | ||||||||||
| UFCF | 49,132.9 | 3,925.9 | 2,241.1 | 4,593.2 | 15,647.4 | 10,214.8 | 5,417.4 | 5,014.8 | 4,642.1 | 4,297.0 |
| WACC, % | 4.52 | 4.52 | 4.52 | 4.52 | 4.51 | 4.52 | 4.52 | 4.52 | 4.52 | 4.52 |
| PV UFCF | ||||||||||
| SUM PV UFCF | 26,459.9 | |||||||||
| Long Term Growth Rate, % | 0.50 | |||||||||
| Free cash flow (T + 1) | 4,319 | |||||||||
| Terminal Value | 107,486 | |||||||||
| Present Terminal Value | 86,179 | |||||||||
| Enterprise Value | 112,639 | |||||||||
| Net Debt | -76,213 | |||||||||
| Equity Value | 188,852 | |||||||||
| Diluted Shares Outstanding, MM | 31 | |||||||||
| Equity Value Per Share | 6,054.30 |
What You Will Receive
- Pre-Filled Financial Model: Actual data from Kato Sangyo Co., Ltd. (9869T) ensures accurate DCF valuation.
- Comprehensive Forecast Control: Modify key drivers such as revenue growth, margins, and WACC.
- Real-Time Calculations: Automatic updates provide immediate feedback as you make adjustments.
- Professional-Grade Template: A polished Excel file crafted for high-quality valuation.
- Flexible and Reusable: Designed for adaptability, allowing for multiple in-depth forecasts.
Main Features
- Customizable Forecast Inputs: Adjust essential variables such as revenue growth, EBITDA percentage, and capital investments.
- Instant DCF Valuation: Quickly calculates intrinsic value, NPV, and other financial metrics.
- High-Precision Accuracy: Leverages Kato Sangyo Co., Ltd.'s (9869T) actual financial data for credible valuation results.
- Simplified Scenario Analysis: Easily test various assumptions and evaluate different outcomes.
- Efficient Valuation Tool: Streamlines the valuation process, eliminating the need to create complex models from the ground up.
How It Works
- Step 1: Download the Excel file.
- Step 2: Examine the pre-filled Kato Sangyo Co., Ltd. (9869T) data (both historical and projected).
- Step 3: Modify key assumptions (highlighted in yellow) based on your findings.
- Step 4: Observe automatic recalculations for Kato Sangyo Co., Ltd.'s intrinsic value.
- Step 5: Utilize the results for your investment strategies or reporting needs.
Why Choose This Calculator for Kato Sangyo Co., Ltd. (9869T)?
- Designed for Experts: A sophisticated tool tailored for analysts, CFOs, and industry consultants.
- Comprehensive Data: Includes Kato Sangyo’s historical and projected financials for precise evaluations.
- Scenario Analysis: Effortlessly test various forecasts and assumptions.
- Transparent Results: Automatically determines intrinsic value, NPV, and essential financial metrics.
- User-Friendly Interface: Guided instructions make the process straightforward.
Who Can Benefit from This Product?
- Investors: Assess Kato Sangyo Co., Ltd.'s ([9869T]) valuation prior to trading stocks.
- CFOs and Financial Analysts: Optimize valuation workflows and evaluate financial forecasts.
- Startup Founders: Discover the valuation methods applied to leading public companies like Kato Sangyo Co., Ltd. ([9869T]).
- Consultants: Create detailed valuation reports for your clients involving Kato Sangyo Co., Ltd. ([9869T]).
- Students and Educators: Utilize real data from Kato Sangyo Co., Ltd. ([9869T]) to teach and practice valuation strategies.
Contents of the Template
- In-Depth DCF Model: An editable template featuring comprehensive valuation calculations.
- Actual Financial Data: Kato Sangyo Co., Ltd.’s (9869T) historical and projected financials preloaded for thorough analysis.
- Adjustable Variables: Modify WACC, growth rates, and tax assumptions to evaluate different scenarios.
- Complete Financial Statements: Detailed annual and quarterly breakdowns offering deeper insights.
- Essential Ratios: Integrated analysis for profitability, efficiency, and leverage metrics.
- Interactive Dashboard: Visual representations with charts and tables for clear, actionable insights.
Disclaimer
All information, articles, and product details provided on this website are for general informational and educational purposes only. We do not claim any ownership over, nor do we intend to infringe upon, any trademarks, copyrights, logos, brand names, or other intellectual property mentioned or depicted on this site. Such intellectual property remains the property of its respective owners, and any references here are made solely for identification or informational purposes, without implying any affiliation, endorsement, or partnership.
We make no representations or warranties, express or implied, regarding the accuracy, completeness, or suitability of any content or products presented. Nothing on this website should be construed as legal, tax, investment, financial, medical, or other professional advice. In addition, no part of this site—including articles or product references—constitutes a solicitation, recommendation, endorsement, advertisement, or offer to buy or sell any securities, franchises, or other financial instruments, particularly in jurisdictions where such activity would be unlawful.
All content is of a general nature and may not address the specific circumstances of any individual or entity. It is not a substitute for professional advice or services. Any actions you take based on the information provided here are strictly at your own risk. You accept full responsibility for any decisions or outcomes arising from your use of this website and agree to release us from any liability in connection with your use of, or reliance upon, the content or products found herein.