
|
Inaba Denki Sangyo Co., Ltd. (9934.T) Avaliação DCF |
Totalmente Editável: Adapte-Se Às Suas Necessidades No Excel Ou Planilhas
Design Profissional: Modelos Confiáveis E Padrão Da Indústria
Pré-Construídos Para Uso Rápido E Eficiente
Compatível com MAC/PC, totalmente desbloqueado
Não É Necessária Experiência; Fácil De Seguir
Inaba Denki Sangyo Co.,Ltd. (9934.T) Bundle
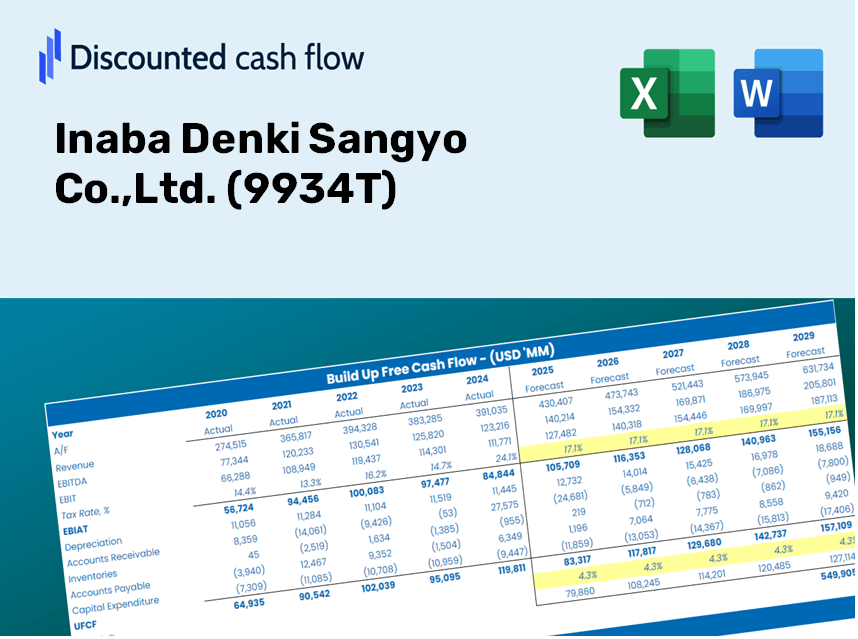
Explore as perspectivas financeiras da Inaba Denki Sangyo Co., Ltd. (9934T) com nossa calculadora DCF amigável! Digite suas suposições sobre crescimento, margens e despesas para determinar o valor intrínseco de Inaba Denki Sangyo Co., Ltd. (9934T) e informe suas decisões de investimento.
Benefits of Choosing Inaba Denki Sangyo Co., Ltd. (9934T)
- Comprehensive Financial Model: Utilize Inaba Denki Sangyo's actual financial data for accurate DCF valuation.
- Complete Forecasting Flexibility: Modify key metrics such as revenue growth, profit margins, WACC, and other crucial parameters.
- Real-Time Calculations: Instant updates allow you to view results dynamically as adjustments are made.
- Professional-Grade Template: A polished Excel template structured for serious investment analysis.
- Adaptable and Reusable: Designed for versatility, making it easy to create detailed forecasts repeatedly.
Key Features
- Comprehensive DCF Calculator: Features detailed unlevered and levered DCF valuation models tailored for Inaba Denki Sangyo Co., Ltd. (9934T).
- WACC Calculator: Includes a pre-structured Weighted Average Cost of Capital sheet with adjustable inputs specific to the company's parameters.
- Customizable Forecast Assumptions: Adjust growth rates, capital expenditures, and discount rates as needed.
- Integrated Financial Ratios: Evaluate profitability, leverage, and efficiency ratios pertinent to Inaba Denki Sangyo Co., Ltd. (9934T).
- User-Friendly Dashboard and Charts: Visual representations summarize essential valuation metrics for straightforward analysis.
How It Works
- Step 1: Download the prebuilt Excel template featuring Inaba Denki Sangyo Co., Ltd.'s (9934T) data.
- Step 2: Navigate through the pre-filled sheets to familiarize yourself with the key performance indicators.
- Step 3: Modify forecasts and assumptions in the editable yellow cells (WACC, growth, margins).
- Step 4: Instantly view the updated results, including the intrinsic value of Inaba Denki Sangyo Co., Ltd. (9934T).
- Step 5: Utilize the output to make informed investment decisions or create comprehensive reports.
Why Choose This Calculator for Inaba Denki Sangyo Co., Ltd. (9934T)?
- Designed for Experts: A sophisticated tool utilized by financial analysts, CFOs, and industry consultants.
- Accurate Financial Insights: Inaba Denki Sangyo's historical and projected financial data preloaded for precision.
- Flexible Scenario Analysis: Effortlessly simulate various forecasts and assumptions.
- Comprehensive Outputs: Automatically computes intrinsic value, NPV, and essential financial metrics.
- User-Friendly Interface: Clear, step-by-step guidance throughout the calculation process.
Who Can Benefit from This Product?
- Individual Investors: Gain insights to make informed choices about trading Inaba Denki Sangyo Co., Ltd. (9934T) shares.
- Financial Analysts: Enhance valuation methods with comprehensive financial models tailored for Inaba Denki Sangyo Co., Ltd. (9934T).
- Consultants: Provide clients with swift and accurate valuation analyses related to Inaba Denki Sangyo Co., Ltd. (9934T).
- Business Owners: Learn about the valuation approaches of established companies like Inaba Denki Sangyo Co., Ltd. (9934T) to inform your own business strategy.
- Finance Students: Master valuation principles through the study of real-world data and case studies involving Inaba Denki Sangyo Co., Ltd. (9934T).
Contents of the Template for Inaba Denki Sangyo Co., Ltd. (9934T)
- Pre-Filled Data: Contains Inaba Denki Sangyo’s historical financial performance and projections.
- Discounted Cash Flow Model: An editable DCF valuation model with automated calculations.
- Weighted Average Cost of Capital (WACC): A dedicated worksheet for WACC calculation based on user-defined inputs.
- Key Financial Ratios: Evaluate Inaba Denki Sangyo’s profitability, operational efficiency, and financial leverage.
- Customizable Inputs: Easily modify revenue growth rates, profit margins, and tax percentages.
- Clear Dashboard: Visual representation of key valuation outcomes through charts and tables.
Disclaimer
All information, articles, and product details provided on this website are for general informational and educational purposes only. We do not claim any ownership over, nor do we intend to infringe upon, any trademarks, copyrights, logos, brand names, or other intellectual property mentioned or depicted on this site. Such intellectual property remains the property of its respective owners, and any references here are made solely for identification or informational purposes, without implying any affiliation, endorsement, or partnership.
We make no representations or warranties, express or implied, regarding the accuracy, completeness, or suitability of any content or products presented. Nothing on this website should be construed as legal, tax, investment, financial, medical, or other professional advice. In addition, no part of this site—including articles or product references—constitutes a solicitation, recommendation, endorsement, advertisement, or offer to buy or sell any securities, franchises, or other financial instruments, particularly in jurisdictions where such activity would be unlawful.
All content is of a general nature and may not address the specific circumstances of any individual or entity. It is not a substitute for professional advice or services. Any actions you take based on the information provided here are strictly at your own risk. You accept full responsibility for any decisions or outcomes arising from your use of this website and agree to release us from any liability in connection with your use of, or reliance upon, the content or products found herein.