
|
Misumi Group Inc. (9962.T) Avaliação DCF |
Totalmente Editável: Adapte-Se Às Suas Necessidades No Excel Ou Planilhas
Design Profissional: Modelos Confiáveis E Padrão Da Indústria
Pré-Construídos Para Uso Rápido E Eficiente
Compatível com MAC/PC, totalmente desbloqueado
Não É Necessária Experiência; Fácil De Seguir
MISUMI Group Inc. (9962.T) Bundle
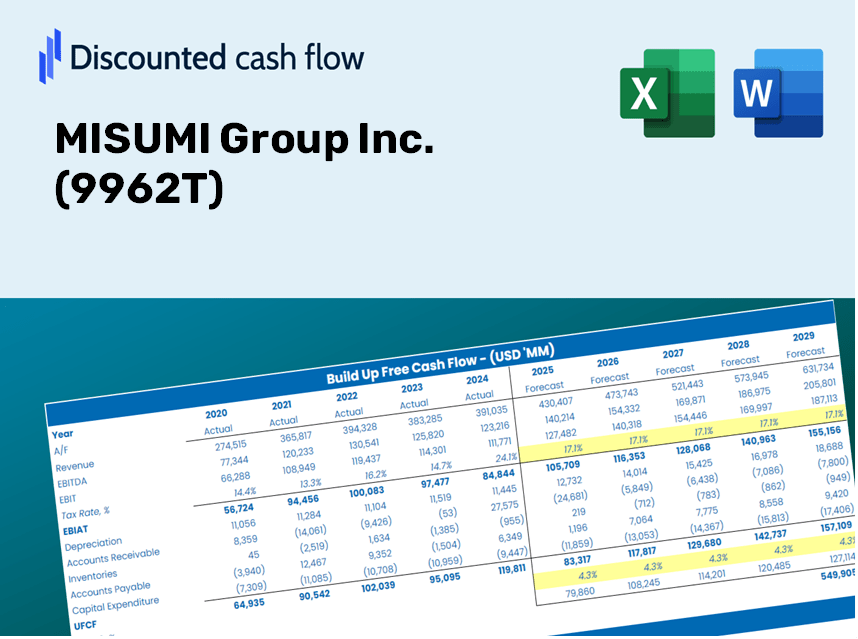
Ganhe domínio sobre o seu Misumi Group Inc. (9962T) Análise de avaliação com nossa sofisticada calculadora DCF! Pré -carregado com dados reais para (9962T), este modelo do Excel permite ajustar as previsões e suposições para determinar com precisão o valor intrínseco do grupo Misumi Inc.
Discounted Cash Flow (DCF) - (USD MM)
| Year | AY1 2021 |
AY2 2022 |
AY3 2023 |
AY4 2024 |
AY5 2025 |
FY1 2026 |
FY2 2027 |
FY3 2028 |
FY4 2029 |
FY5 2030 |
|---|---|---|---|---|---|---|---|---|---|---|
| Revenue | 310,719.0 | 366,160.0 | 373,151.0 | 367,649.0 | 401,987.0 | 429,741.7 | 459,412.7 | 491,132.2 | 525,041.9 | 561,292.7 |
| Revenue Growth, % | 0 | 17.84 | 1.91 | -1.47 | 9.34 | 6.9 | 6.9 | 6.9 | 6.9 | 6.9 |
| EBITDA | 38,526.0 | 66,571.0 | 63,202.0 | 56,932.0 | 65,786.0 | 68,215.3 | 72,925.2 | 77,960.2 | 83,342.9 | 89,097.2 |
| EBITDA, % | 12.4 | 18.18 | 16.94 | 15.49 | 16.37 | 15.87 | 15.87 | 15.87 | 15.87 | 15.87 |
| Depreciation | 14,963.0 | 15,341.0 | 16,587.0 | 17,564.0 | 17,718.0 | 19,454.8 | 20,798.0 | 22,234.0 | 23,769.1 | 25,410.2 |
| Depreciation, % | 4.82 | 4.19 | 4.45 | 4.78 | 4.41 | 4.53 | 4.53 | 4.53 | 4.53 | 4.53 |
| EBIT | 23,563.0 | 51,230.0 | 46,615.0 | 39,368.0 | 48,068.0 | 48,760.6 | 52,127.2 | 55,726.3 | 59,573.8 | 63,687.0 |
| EBIT, % | 7.58 | 13.99 | 12.49 | 10.71 | 11.96 | 11.35 | 11.35 | 11.35 | 11.35 | 11.35 |
| Total Cash | 72,428.0 | 108,895.0 | 119,558.0 | 148,848.0 | 159,296.0 | 141,989.4 | 151,792.9 | 162,273.3 | 173,477.2 | 185,454.8 |
| Total Cash, percent | .0 | .0 | .0 | .0 | .0 | .0 | .0 | .0 | .0 | .0 |
| Account Receivables | 71,410.0 | 76,537.0 | 75,923.0 | 75,567.0 | 79,843.0 | 89,942.7 | 96,152.7 | 102,791.5 | 109,888.6 | 117,475.7 |
| Account Receivables, % | 22.98 | 20.9 | 20.35 | 20.55 | 19.86 | 20.93 | 20.93 | 20.93 | 20.93 | 20.93 |
| Inventories | 55,343.0 | 61,740.0 | 77,389.0 | 78,377.0 | 69,652.0 | 80,840.8 | 86,422.4 | 92,389.3 | 98,768.2 | 105,587.5 |
| Inventories, % | 17.81 | 16.86 | 20.74 | 21.32 | 17.33 | 18.81 | 18.81 | 18.81 | 18.81 | 18.81 |
| Accounts Payable | 19,458.0 | 21,617.0 | 22,434.0 | 20,984.0 | 21,189.0 | 25,059.7 | 26,789.9 | 28,639.6 | 30,617.0 | 32,730.9 |
| Accounts Payable, % | 6.26 | 5.9 | 6.01 | 5.71 | 5.27 | 5.83 | 5.83 | 5.83 | 5.83 | 5.83 |
| Capital Expenditure | -14,016.0 | -16,508.0 | -13,625.0 | -17,976.0 | -15,434.0 | -18,392.5 | -19,662.4 | -21,019.9 | -22,471.2 | -24,022.7 |
| Capital Expenditure, % | -4.51 | -4.51 | -3.65 | -4.89 | -3.84 | -4.28 | -4.28 | -4.28 | -4.28 | -4.28 |
| Tax Rate, % | 26.81 | 26.81 | 26.81 | 26.81 | 26.81 | 26.81 | 26.81 | 26.81 | 26.81 | 26.81 |
| EBITAT | 17,186.9 | 37,629.7 | 34,342.4 | 28,259.0 | 35,179.0 | 35,598.4 | 38,056.2 | 40,683.8 | 43,492.7 | 46,495.6 |
| Depreciation | ||||||||||
| Changes in Account Receivables | ||||||||||
| Changes in Inventories | ||||||||||
| Changes in Accounts Payable | ||||||||||
| Capital Expenditure | ||||||||||
| UFCF | -89,161.1 | 27,097.7 | 23,086.4 | 25,765.0 | 42,117.0 | 19,242.8 | 29,130.5 | 31,141.8 | 33,292.0 | 35,590.6 |
| WACC, % | 7.69 | 7.69 | 7.69 | 7.69 | 7.69 | 7.69 | 7.69 | 7.69 | 7.69 | 7.69 |
| PV UFCF | ||||||||||
| SUM PV UFCF | 117,246.2 | |||||||||
| Long Term Growth Rate, % | 2.00 | |||||||||
| Free cash flow (T + 1) | 36,302 | |||||||||
| Terminal Value | 637,895 | |||||||||
| Present Terminal Value | 440,405 | |||||||||
| Enterprise Value | 557,652 | |||||||||
| Net Debt | -151,760 | |||||||||
| Equity Value | 709,412 | |||||||||
| Diluted Shares Outstanding, MM | 278 | |||||||||
| Equity Value Per Share | 2,554.82 |
What You Will Receive
- Authentic MISUMI Data: Preloaded financials – encompassing revenue to EBIT – derived from actual and projected figures.
- Complete Customization: Modify all key parameters (yellow cells) such as WACC, growth %, and tax rates.
- Immediate Valuation Updates: Automatic recalculations to assess the impact of adjustments on MISUMI's fair value.
- Flexible Excel Template: Designed for quick modifications, scenario analysis, and comprehensive projections.
- Efficient and Precise: Eliminate the need to build models from the ground up while ensuring accuracy and adaptability.
Key Features
- Authentic MISUMI Financials: Gain access to precise pre-loaded historical data and forward-looking projections.
- Customizable Forecast Assumptions: Modify the yellow-highlighted cells for WACC, growth rates, and profit margins as needed.
- Dynamic Calculations: Experience automatic updates for DCF, Net Present Value (NPV), and cash flow analyses.
- Visual Dashboard: Utilize intuitive charts and summaries to effectively visualize your valuation outcomes.
- For Both Professionals and Beginners: Designed with a straightforward, user-friendly structure tailored for investors, CFOs, and consultants alike.
How It Works
- Step 1: Download the prebuilt Excel template featuring MISUMI Group Inc.'s data.
- Step 2: Review the pre-filled sheets to familiarize yourself with the key performance metrics.
- Step 3: Modify forecasts and assumptions in the editable yellow cells (WACC, growth, margins).
- Step 4: Instantly see recalculated outcomes, including MISUMI Group Inc.'s intrinsic value.
- Step 5: Use the results to make well-informed investment decisions or create reports.
Why Choose the MISUMI Group Inc. Calculator?
- Precision: Leveraging accurate MISUMI Group Inc. (9962T) financials for reliable results.
- Flexible Input: Users can easily tweak and experiment with input variables.
- Efficiency: Avoid the complexities of creating a DCF model from the ground up.
- High-Quality Standards: Crafted with the expertise and detail expected from a top-tier financial tool.
- Intuitive Design: Simple to navigate, catering to users with varying levels of financial modeling skills.
Who Can Benefit from MISUMI Group Inc. (9962T) Solutions?
- Manufacturers: Streamline your production processes with our precision components.
- Design Engineers: Access a vast selection of customizable parts to bring your designs to life efficiently.
- Procurement Specialists: Simplify your sourcing with our comprehensive catalog and fast delivery options.
- Quality Control Teams: Ensure top-notch quality with fully traceable components tailored to your specifications.
- Students and Instructors: Utilize our resources for hands-on learning in engineering and manufacturing courses.
Contents of the Template
- Historical Data: Comprises MISUMI Group Inc.'s past financials and baseline projections.
- DCF and Levered DCF Models: Comprehensive templates for calculating the intrinsic value of MISUMI Group Inc. (9962T).
- WACC Sheet: Pre-calculated metrics for the Weighted Average Cost of Capital.
- Editable Inputs: Adjust key parameters such as growth rates, EBITDA %, and CAPEX assumptions.
- Quarterly and Annual Statements: A thorough breakdown of MISUMI Group Inc. (9962T)'s financials.
- Interactive Dashboard: Dynamic visualization of valuation results and projections.
Disclaimer
All information, articles, and product details provided on this website are for general informational and educational purposes only. We do not claim any ownership over, nor do we intend to infringe upon, any trademarks, copyrights, logos, brand names, or other intellectual property mentioned or depicted on this site. Such intellectual property remains the property of its respective owners, and any references here are made solely for identification or informational purposes, without implying any affiliation, endorsement, or partnership.
We make no representations or warranties, express or implied, regarding the accuracy, completeness, or suitability of any content or products presented. Nothing on this website should be construed as legal, tax, investment, financial, medical, or other professional advice. In addition, no part of this site—including articles or product references—constitutes a solicitation, recommendation, endorsement, advertisement, or offer to buy or sell any securities, franchises, or other financial instruments, particularly in jurisdictions where such activity would be unlawful.
All content is of a general nature and may not address the specific circumstances of any individual or entity. It is not a substitute for professional advice or services. Any actions you take based on the information provided here are strictly at your own risk. You accept full responsibility for any decisions or outcomes arising from your use of this website and agree to release us from any liability in connection with your use of, or reliance upon, the content or products found herein.