
|
Softbank Group Corp. (9984.T) Avaliação DCF |
Totalmente Editável: Adapte-Se Às Suas Necessidades No Excel Ou Planilhas
Design Profissional: Modelos Confiáveis E Padrão Da Indústria
Pré-Construídos Para Uso Rápido E Eficiente
Compatível com MAC/PC, totalmente desbloqueado
Não É Necessária Experiência; Fácil De Seguir
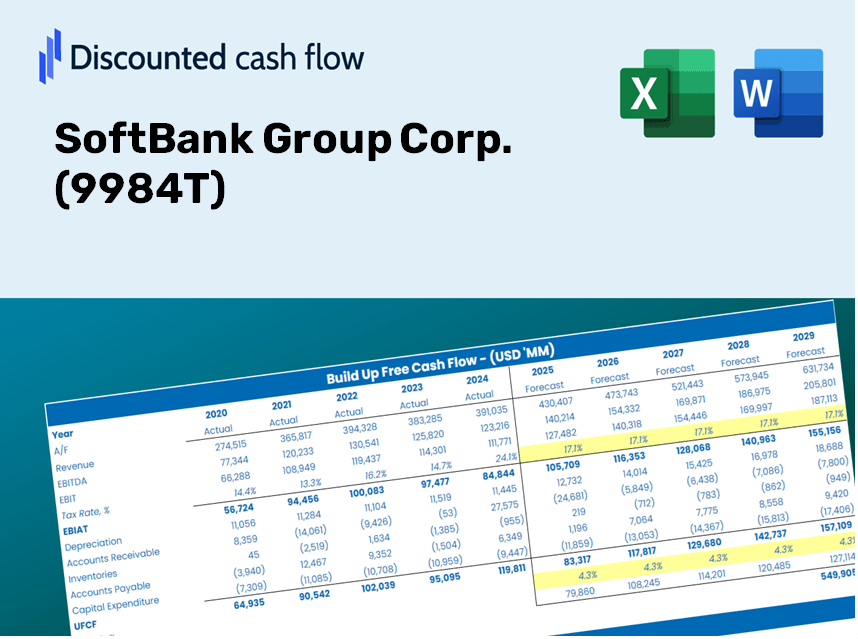
SoftBank Group Corp. (9984.T) Bundle
Projetado para precisão, nossa calculadora DCF (9984T) permite avaliar a avaliação do SoftBank Group Corp. usando dados financeiros do mundo real, oferecendo flexibilidade completa para modificar todos os parâmetros principais para melhorar projeções.
Discounted Cash Flow (DCF) - (USD MM)
| Year | AY1 2021 |
AY2 2022 |
AY3 2023 |
AY4 2024 |
AY5 2025 |
FY1 2026 |
FY2 2027 |
FY3 2028 |
FY4 2029 |
FY5 2030 |
|---|---|---|---|---|---|---|---|---|---|---|
| Revenue | 5,628,167.0 | 6,221,534.0 | 6,570,439.0 | 6,756,500.0 | 7,243,752.0 | 7,718,113.2 | 8,223,538.2 | 8,762,061.2 | 9,335,849.8 | 9,947,213.2 |
| Revenue Growth, % | 0 | 10.54 | 5.61 | 2.83 | 7.21 | 6.55 | 6.55 | 6.55 | 6.55 | 6.55 |
| EBITDA | 1,454,748.0 | 365,374.0 | 980,263.0 | 1,472,425.0 | 1,596,617.0 | 1,396,572.1 | 1,488,027.4 | 1,585,471.8 | 1,689,297.3 | 1,799,921.9 |
| EBITDA, % | 25.85 | 5.87 | 14.92 | 21.79 | 22.04 | 18.09 | 18.09 | 18.09 | 18.09 | 18.09 |
| Depreciation | 851,316.0 | 852,424.0 | 893,488.0 | 858,620.0 | 866,823.0 | 1,035,775.9 | 1,103,604.3 | 1,175,874.4 | 1,252,877.2 | 1,334,922.6 |
| Depreciation, % | 15.13 | 13.7 | 13.6 | 12.71 | 11.97 | 13.42 | 13.42 | 13.42 | 13.42 | 13.42 |
| EBIT | 603,432.0 | -487,050.0 | 86,775.0 | 613,805.0 | 729,794.0 | 360,796.2 | 384,423.1 | 409,597.3 | 436,420.0 | 464,999.2 |
| EBIT, % | 10.72 | -7.83 | 1.32 | 9.08 | 10.07 | 4.67 | 4.67 | 4.67 | 4.67 | 4.67 |
| Total Cash | 5,320,952.0 | 5,327,095.0 | 6,925,153.0 | 6,186,874.0 | 3,713,028.0 | 6,529,408.6 | 6,956,990.6 | 7,412,573.1 | 7,897,989.6 | 8,415,193.9 |
| Total Cash, percent | .0 | .0 | .0 | .0 | .0 | .0 | .0 | .0 | .0 | .0 |
| Account Receivables | 2,216,434.0 | 2,361,149.0 | 2,594,736.0 | 2,868,767.0 | 3,008,144.0 | 3,099,751.5 | 3,302,740.5 | 3,519,022.3 | 3,749,467.5 | 3,995,003.5 |
| Account Receivables, % | 39.38 | 37.95 | 39.49 | 42.46 | 41.53 | 40.16 | 40.16 | 40.16 | 40.16 | 40.16 |
| Inventories | 126,830.0 | 142,767.0 | 163,781.0 | 161,863.0 | 198,291.0 | 187,920.2 | 200,226.3 | 213,338.2 | 227,308.8 | 242,194.3 |
| Inventories, % | 2.25 | 2.29 | 2.49 | 2.4 | 2.74 | 2.43 | 2.43 | 2.43 | 2.43 | 2.43 |
| Accounts Payable | 1,970,275.0 | 1,968,864.0 | 2,416,872.0 | 2,710,529.0 | 3,036,349.0 | 2,862,980.6 | 3,050,464.6 | 3,250,225.9 | 3,463,068.8 | 3,689,849.8 |
| Accounts Payable, % | 35.01 | 31.65 | 36.78 | 40.12 | 41.92 | 37.09 | 37.09 | 37.09 | 37.09 | 37.09 |
| Capital Expenditure | -646,888.0 | -835,073.0 | -633,765.0 | -622,612.0 | -854,173.0 | -857,769.9 | -913,941.5 | -973,791.5 | -1,037,560.8 | -1,105,506.0 |
| Capital Expenditure, % | -11.49 | -13.42 | -9.65 | -9.22 | -11.79 | -11.11 | -11.11 | -11.11 | -11.11 | -11.11 |
| Tax Rate, % | 32.34 | 32.34 | 32.34 | 32.34 | 32.34 | 32.34 | 32.34 | 32.34 | 32.34 | 32.34 |
| EBITAT | 530,803.1 | -956,683.4 | 179,448.7 | -2,417,436.6 | 493,743.4 | 256,612.1 | 273,416.5 | 291,321.3 | 310,398.7 | 330,725.3 |
| Depreciation | ||||||||||
| Changes in Account Receivables | ||||||||||
| Changes in Inventories | ||||||||||
| Changes in Accounts Payable | ||||||||||
| Capital Expenditure | ||||||||||
| UFCF | 362,242.1 | -1,101,395.4 | 632,578.7 | -2,159,884.6 | 656,408.4 | 180,013.0 | 435,268.2 | 463,772.0 | 494,142.3 | 526,501.5 |
| WACC, % | 5.62 | 5.79 | 5.79 | 4.33 | 5.32 | 5.37 | 5.37 | 5.37 | 5.37 | 5.37 |
| PV UFCF | ||||||||||
| SUM PV UFCF | 1,765,400.7 | |||||||||
| Long Term Growth Rate, % | 2.00 | |||||||||
| Free cash flow (T + 1) | 537,032 | |||||||||
| Terminal Value | 15,928,987 | |||||||||
| Present Terminal Value | 12,262,363 | |||||||||
| Enterprise Value | 14,027,764 | |||||||||
| Net Debt | 15,200,322 | |||||||||
| Equity Value | -1,172,558 | |||||||||
| Diluted Shares Outstanding, MM | 1,454 | |||||||||
| Equity Value Per Share | -806.42 |
Benefits You Will Receive
- Authentic SoftBank Data: Preloaded financials – encompassing revenue to EBIT – derived from actual and estimated figures.
- Complete Customization: Modify all essential parameters (yellow cells) such as WACC, growth %, and tax rates.
- Immediate Valuation Updates: Automatic recalculations to assess how changes affect SoftBank's fair value.
- Flexible Excel Template: Designed for easy edits, scenario exploration, and comprehensive projections.
- Efficient and Precise: Avoid the hassle of building models from scratch while ensuring accuracy and adaptability.
Key Features
- Real-Time SoftBank Data: Preloaded with SoftBank's historical financial information and future projections.
- Customizable Input Options: Modify revenue growth rates, profit margins, WACC, tax rates, and capital expenditures.
- Dynamic Valuation Framework: Automatic recalculations of Net Present Value (NPV) and intrinsic value based on your specified inputs.
- Scenario Analysis: Develop various forecasting scenarios to evaluate different valuation results.
- User-Centric Interface: Intuitive and organized design catering to both seasoned professionals and newcomers.
How It Works
- Step 1: Download the Excel file.
- Step 2: Examine SoftBank Group Corp.'s (9984T) pre-filled financial data and forecasts.
- Step 3: Adjust key inputs such as revenue growth, WACC, and tax rates (highlighted cells).
- Step 4: Observe the DCF model refresh in real-time as you modify your assumptions.
- Step 5: Review the outputs and leverage the results for your investment strategies.
Why Select This Calculator for SoftBank Group Corp. (9984T)?
- Reliable Data: Utilize authentic SoftBank financials for trustworthy valuation outcomes.
- Customizable Features: Modify essential variables such as growth rates, WACC, and tax rates to align with your forecasts.
- Efficiency Boost: Pre-configured calculations save you the effort of starting from zero.
- Professional-Grade Resource: Tailored for investors, analysts, and consultants in the financial sector.
- User-Friendly Design: An intuitive interface with clear step-by-step guidance makes it accessible for all users.
Who Can Benefit from This Product?
- Investors: Evaluate SoftBank Group Corp.’s (9984T) valuation to make informed stock trading decisions.
- CFOs and Financial Analysts: Optimize valuation methodologies and validate financial forecasts.
- Startup Founders: Gain insights on how large public entities, like SoftBank Group Corp., are appraised.
- Consultants: Provide clients with comprehensive and professional valuation assessments.
- Students and Educators: Utilize live market data to practice and instruct on valuation strategies.
Contents of the Template
- Preloaded SoftBank Data: Historical and projected financial metrics, including revenue, EBIT, and capital expenditures.
- DCF and WACC Models: High-quality sheets designed for calculating intrinsic value and Weighted Average Cost of Capital.
- Editable Inputs: Yellow-highlighted cells for modifying revenue growth rates, tax rates, and discount rates.
- Financial Statements: Detailed annual and quarterly financials for in-depth analysis.
- Key Ratios: Ratios for profitability, leverage, and efficiency to assess overall performance.
- Dashboard and Charts: Visual representations of valuation results and underlying assumptions.
Disclaimer
All information, articles, and product details provided on this website are for general informational and educational purposes only. We do not claim any ownership over, nor do we intend to infringe upon, any trademarks, copyrights, logos, brand names, or other intellectual property mentioned or depicted on this site. Such intellectual property remains the property of its respective owners, and any references here are made solely for identification or informational purposes, without implying any affiliation, endorsement, or partnership.
We make no representations or warranties, express or implied, regarding the accuracy, completeness, or suitability of any content or products presented. Nothing on this website should be construed as legal, tax, investment, financial, medical, or other professional advice. In addition, no part of this site—including articles or product references—constitutes a solicitation, recommendation, endorsement, advertisement, or offer to buy or sell any securities, franchises, or other financial instruments, particularly in jurisdictions where such activity would be unlawful.
All content is of a general nature and may not address the specific circumstances of any individual or entity. It is not a substitute for professional advice or services. Any actions you take based on the information provided here are strictly at your own risk. You accept full responsibility for any decisions or outcomes arising from your use of this website and agree to release us from any liability in connection with your use of, or reliance upon, the content or products found herein.