
|
Radiance Holdings Company Limited (9993.HK) Avaliação DCF |
Totalmente Editável: Adapte-Se Às Suas Necessidades No Excel Ou Planilhas
Design Profissional: Modelos Confiáveis E Padrão Da Indústria
Pré-Construídos Para Uso Rápido E Eficiente
Compatível com MAC/PC, totalmente desbloqueado
Não É Necessária Experiência; Fácil De Seguir
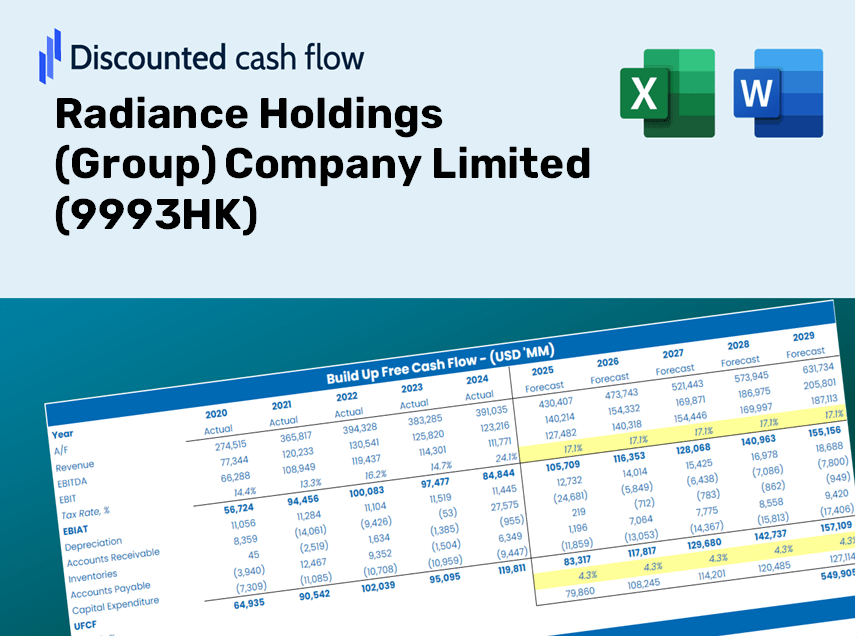
Radiance Holdings (Group) Company Limited (9993.HK) Bundle
Avalie as perspectivas financeiras da Radiance Holdings (Grupo) Company Limited (9993HK) como um especialista! Esta calculadora DCF (9993HK) fornece dados financeiros pré-preenchidos e flexibilidade para modificar o crescimento da receita, o WACC, as margens de lucro e outras suposições essenciais para se alinhar às suas projeções.
Discounted Cash Flow (DCF) - (USD MM)
| Year | AY1 2020 |
AY2 2021 |
AY3 2022 |
AY4 2023 |
AY5 2024 |
FY1 2025 |
FY2 2026 |
FY3 2027 |
FY4 2028 |
FY5 2029 |
|---|---|---|---|---|---|---|---|---|---|---|
| Revenue | 38,090.0 | 43,715.4 | 38,573.6 | 37,405.7 | 27,049.0 | 25,175.3 | 23,431.3 | 21,808.2 | 20,297.6 | 18,891.5 |
| Revenue Growth, % | 0 | 14.77 | -11.76 | -3.03 | -27.69 | -6.93 | -6.93 | -6.93 | -6.93 | -6.93 |
| EBITDA | 7,794.6 | 7,535.9 | 4,392.2 | 1,156.5 | -7,894.2 | 1,157.8 | 1,077.6 | 1,003.0 | 933.5 | 868.8 |
| EBITDA, % | 20.46 | 17.24 | 11.39 | 3.09 | -29.18 | 4.6 | 4.6 | 4.6 | 4.6 | 4.6 |
| Depreciation | 81.6 | 92.2 | 86.3 | 71.3 | 24.0 | 46.7 | 43.5 | 40.5 | 37.7 | 35.1 |
| Depreciation, % | 0.21431 | 0.21081 | 0.2236 | 0.19068 | 0.08880304 | 0.18564 | 0.18564 | 0.18564 | 0.18564 | 0.18564 |
| EBIT | 7,713.0 | 7,443.8 | 4,306.0 | 1,085.2 | -7,918.2 | 1,111.1 | 1,034.1 | 962.5 | 895.8 | 833.8 |
| EBIT, % | 20.25 | 17.03 | 11.16 | 2.9 | -29.27 | 4.41 | 4.41 | 4.41 | 4.41 | 4.41 |
| Total Cash | 22,680.1 | 12,341.9 | 13,459.8 | 5,276.8 | 2,001.0 | 7,259.3 | 6,756.4 | 6,288.4 | 5,852.8 | 5,447.3 |
| Total Cash, percent | .0 | .0 | .0 | .0 | .0 | .0 | .0 | .0 | .0 | .0 |
| Account Receivables | 11,055.1 | 18,200.2 | 66.1 | 43.1 | 40.9 | 3,579.7 | 3,331.7 | 3,100.9 | 2,886.1 | 2,686.2 |
| Account Receivables, % | 29.02 | 41.63 | 0.17136 | 0.11521 | 0.15138 | 14.22 | 14.22 | 14.22 | 14.22 | 14.22 |
| Inventories | 113,576.5 | 115,889.8 | 110,336.4 | 68,348.7 | 56,548.8 | 25,175.3 | 23,431.3 | 21,808.2 | 20,297.6 | 18,891.5 |
| Inventories, % | 298.18 | 265.1 | 286.04 | 182.72 | 209.06 | 100 | 100 | 100 | 100 | 100 |
| Accounts Payable | 14,113.8 | 14,857.5 | 14,314.2 | 12,072.5 | 11,179.6 | 9,151.5 | 8,517.5 | 7,927.5 | 7,378.4 | 6,867.2 |
| Accounts Payable, % | 37.05 | 33.99 | 37.11 | 32.27 | 41.33 | 36.35 | 36.35 | 36.35 | 36.35 | 36.35 |
| Capital Expenditure | -33.6 | -947.4 | -73.4 | -213.9 | -116.7 | -173.7 | -161.6 | -150.4 | -140.0 | -130.3 |
| Capital Expenditure, % | -0.08830063 | -2.17 | -0.19029 | -0.57188 | -0.43152 | -0.68985 | -0.68985 | -0.68985 | -0.68985 | -0.68985 |
| Tax Rate, % | -3.28 | -3.28 | -3.28 | -3.28 | -3.28 | -3.28 | -3.28 | -3.28 | -3.28 | -3.28 |
| EBITAT | 3,690.3 | 3,770.2 | 1,980.8 | -904.0 | -8,177.8 | 543.3 | 505.7 | 470.7 | 438.1 | 407.7 |
| Depreciation | ||||||||||
| Changes in Account Receivables | ||||||||||
| Changes in Inventories | ||||||||||
| Changes in Accounts Payable | ||||||||||
| Capital Expenditure | ||||||||||
| UFCF | -106,779.5 | -5,799.7 | 25,137.8 | 38,722.4 | 2,638.6 | 26,223.1 | 1,745.5 | 1,624.6 | 1,512.1 | 1,407.3 |
| WACC, % | 3.36 | 3.44 | 3.31 | 1.97 | 4.87 | 3.39 | 3.39 | 3.39 | 3.39 | 3.39 |
| PV UFCF | ||||||||||
| SUM PV UFCF | 30,980.2 | |||||||||
| Long Term Growth Rate, % | 2.00 | |||||||||
| Free cash flow (T + 1) | 1,435 | |||||||||
| Terminal Value | 103,187 | |||||||||
| Present Terminal Value | 87,339 | |||||||||
| Enterprise Value | 118,320 | |||||||||
| Net Debt | 30,576 | |||||||||
| Equity Value | 87,744 | |||||||||
| Diluted Shares Outstanding, MM | 4,045 | |||||||||
| Equity Value Per Share | 21.69 |
What You Will Receive
- Authentic 9993HK Financial Data: Pre-loaded with Radiance Holdings' historical and projected financial figures for accurate analysis.
- Completely Customizable Template: Easily adjust critical inputs like revenue growth, WACC, and EBITDA percentage.
- Instant Calculations: Witness rapid updates to Radiance Holdings' intrinsic value as you make adjustments.
- Professional Valuation Tool: Tailored for investors, analysts, and consultants seeking reliable DCF outcomes.
- User-Friendly Interface: Intuitive layout and straightforward instructions suitable for all skill levels.
Key Features
- Real-Time 9993HK Data: Pre-loaded with Radiance Holdings' historical financial metrics and future projections.
- Flexible Input Options: Modify parameters such as revenue growth, profit margins, WACC, tax rates, and capital expenditures.
- Dynamic Valuation Framework: Automatic recalculations of Net Present Value (NPV) and intrinsic value in response to your adjustments.
- Scenario Analysis: Develop various forecast scenarios to explore different valuation results.
- User-Centric Interface: Designed to be intuitive and accessible for both seasoned professionals and newcomers.
How It Works
- Step 1: Download the prebuilt Excel template featuring Radiance Holdings (Group) Company Limited’s data.
- Step 2: Navigate through the pre-filled sheets to familiarize yourself with the key metrics.
- Step 3: Modify forecasts and assumptions in the editable yellow cells (WACC, growth, margins).
- Step 4: Instantly see recalculated outcomes, including Radiance Holdings (Group) Company Limited’s intrinsic value.
- Step 5: Utilize the outputs to make informed investment choices or generate comprehensive reports.
Why Opt for This Calculator for Radiance Holdings (Group) Company Limited (9993HK)?
- Precision Data: Utilize authentic financials from Radiance Holdings for trustworthy valuation outcomes.
- Fully Customizable: Tailor essential parameters such as growth rates, WACC, and tax rates to align with your forecasts.
- Efficiency Boost: Leverage pre-built calculations to save time and avoid starting from zero.
- Expert-Level Tool: Crafted specifically for investors, analysts, and consultants.
- Easy to Use: Designed with an intuitive layout and clear, step-by-step guidance for all users.
Who Can Benefit from This Product?
- Investors: Assess Radiance Holdings (Group) Company Limited (9993HK) valuation for informed buying or selling decisions.
- CFOs and Financial Analysts: Enhance valuation workflows and evaluate financial forecasts.
- Startup Founders: Discover the valuation methods used for prominent companies like Radiance Holdings (Group) Company Limited (9993HK).
- Consultants: Create detailed valuation reports to provide actionable insights for clients.
- Students and Educators: Utilize real-time data to explore and teach valuation methodologies.
Contents of the Template
- Preloaded Radiance Holdings Data: Historical and projected financial metrics, including revenue, EBIT, and capital expenditures.
- DCF and WACC Models: Advanced templates for calculating intrinsic value and Weighted Average Cost of Capital.
- Editable Inputs: Yellow-highlighted cells for modifying revenue growth, tax rates, and discount rates.
- Financial Statements: Detailed annual and quarterly financial reports for in-depth analysis.
- Key Ratios: Profitability, leverage, and efficiency ratios to assess performance.
- Dashboard and Charts: Visual representations of valuation results and underlying assumptions.
Disclaimer
All information, articles, and product details provided on this website are for general informational and educational purposes only. We do not claim any ownership over, nor do we intend to infringe upon, any trademarks, copyrights, logos, brand names, or other intellectual property mentioned or depicted on this site. Such intellectual property remains the property of its respective owners, and any references here are made solely for identification or informational purposes, without implying any affiliation, endorsement, or partnership.
We make no representations or warranties, express or implied, regarding the accuracy, completeness, or suitability of any content or products presented. Nothing on this website should be construed as legal, tax, investment, financial, medical, or other professional advice. In addition, no part of this site—including articles or product references—constitutes a solicitation, recommendation, endorsement, advertisement, or offer to buy or sell any securities, franchises, or other financial instruments, particularly in jurisdictions where such activity would be unlawful.
All content is of a general nature and may not address the specific circumstances of any individual or entity. It is not a substitute for professional advice or services. Any actions you take based on the information provided here are strictly at your own risk. You accept full responsibility for any decisions or outcomes arising from your use of this website and agree to release us from any liability in connection with your use of, or reliance upon, the content or products found herein.