
|
Remegen Co., Ltd. (9995.HK) Avaliação DCF |
Totalmente Editável: Adapte-Se Às Suas Necessidades No Excel Ou Planilhas
Design Profissional: Modelos Confiáveis E Padrão Da Indústria
Pré-Construídos Para Uso Rápido E Eficiente
Compatível com MAC/PC, totalmente desbloqueado
Não É Necessária Experiência; Fácil De Seguir
RemeGen Co., Ltd. (9995.HK) Bundle
Simplifique sua análise e melhore a precisão com a nossa calculadora DCF (9995HK)! Utilizando dados reais da Remegen Co., Ltd. e suposições personalizáveis, essa ferramenta o capacita a prever, analisar e valorizar lembrar como um investidor experiente.
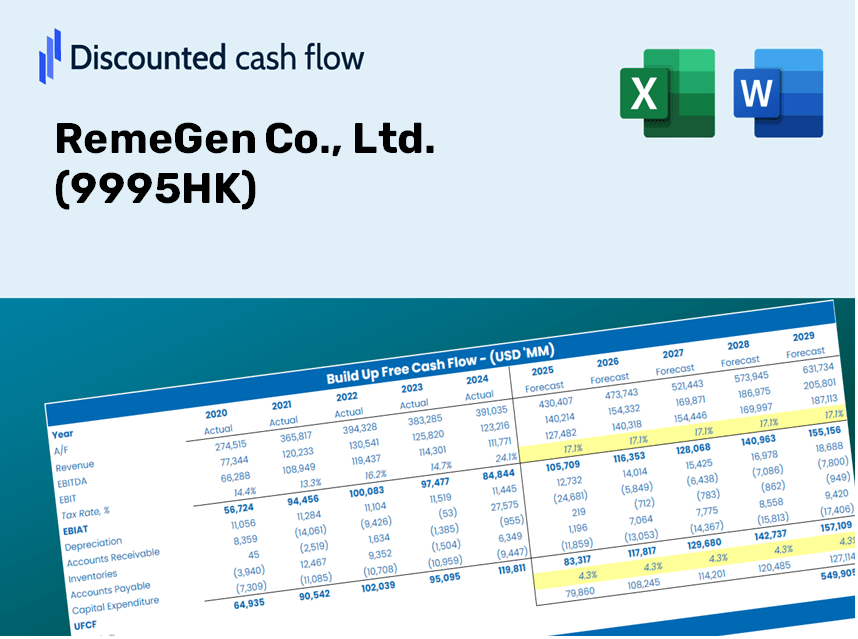
Discounted Cash Flow (DCF) - (USD MM)
| Year | AY1 2020 |
AY2 2021 |
AY3 2022 |
AY4 2023 |
AY5 2024 |
FY1 2025 |
FY2 2026 |
FY3 2027 |
FY4 2028 |
FY5 2029 |
|---|---|---|---|---|---|---|---|---|---|---|
| Revenue | .0 | 1,559.9 | 841.1 | 1,178.9 | 1,880.9 | 2,133.0 | 2,419.0 | 2,743.2 | 3,111.0 | 3,528.1 |
| Revenue Growth, % | 0 | 0 | -46.08 | 40.16 | 59.54 | 13.41 | 13.41 | 13.41 | 13.41 | 13.41 |
| EBITDA | -724.8 | 440.5 | -882.7 | -1,367.1 | -1,307.7 | -602.8 | -683.6 | -775.2 | -879.1 | -997.0 |
| EBITDA, % | 100 | 28.24 | -104.94 | -115.96 | -69.53 | -28.26 | -28.26 | -28.26 | -28.26 | -28.26 |
| Depreciation | 54.7 | 132.0 | 204.2 | 263.2 | 253.1 | 718.9 | 815.3 | 924.6 | 1,048.5 | 1,189.1 |
| Depreciation, % | 100 | 8.46 | 24.27 | 22.33 | 13.46 | 33.7 | 33.7 | 33.7 | 33.7 | 33.7 |
| EBIT | -779.4 | 308.5 | -1,086.8 | -1,630.3 | -1,560.8 | -696.2 | -789.6 | -895.4 | -1,015.5 | -1,151.6 |
| EBIT, % | 100 | 19.78 | -129.21 | -138.29 | -82.98 | -32.64 | -32.64 | -32.64 | -32.64 | -32.64 |
| Total Cash | 3,033.0 | 1,924.7 | 2,396.3 | 776.8 | 832.1 | 1,749.6 | 1,984.2 | 2,250.2 | 2,551.8 | 2,893.9 |
| Total Cash, percent | .0 | .0 | .0 | .0 | .0 | .0 | .0 | .0 | .0 | .0 |
| Account Receivables | 4.6 | 7.7 | 327.7 | 460.6 | 683.1 | 916.5 | 1,039.4 | 1,178.7 | 1,336.7 | 1,515.9 |
| Account Receivables, % | 100 | 0.49512 | 38.96 | 39.07 | 36.32 | 42.97 | 42.97 | 42.97 | 42.97 | 42.97 |
| Inventories | 72.5 | 307.1 | 572.6 | 812.4 | 722.4 | 1,258.8 | 1,427.6 | 1,618.9 | 1,836.0 | 2,082.1 |
| Inventories, % | 100 | 19.69 | 68.08 | 68.91 | 38.41 | 59.02 | 59.02 | 59.02 | 59.02 | 59.02 |
| Accounts Payable | 68.6 | 174.5 | 242.9 | 152.6 | 177.7 | 693.0 | 786.0 | 891.3 | 1,010.8 | 1,146.3 |
| Accounts Payable, % | 100 | 11.18 | 28.87 | 12.95 | 9.45 | 32.49 | 32.49 | 32.49 | 32.49 | 32.49 |
| Capital Expenditure | -526.8 | -676.3 | -829.9 | -934.2 | -290.6 | -1,009.8 | -1,145.2 | -1,298.7 | -1,472.8 | -1,670.3 |
| Capital Expenditure, % | 100 | -43.36 | -98.66 | -79.24 | -15.45 | -47.34 | -47.34 | -47.34 | -47.34 | -47.34 |
| Tax Rate, % | 0 | 0 | 0 | 0 | 0 | 0 | 0 | 0 | 0 | 0 |
| EBITAT | -812.1 | 308.5 | -1,085.8 | -1,630.3 | -1,560.8 | -696.1 | -789.4 | -895.3 | -1,015.3 | -1,151.4 |
| Depreciation | ||||||||||
| Changes in Account Receivables | ||||||||||
| Changes in Inventories | ||||||||||
| Changes in Accounts Payable | ||||||||||
| Capital Expenditure | ||||||||||
| UFCF | -1,292.7 | -367.7 | -2,228.6 | -2,764.2 | -1,705.7 | -1,241.6 | -1,318.1 | -1,494.8 | -1,695.1 | -1,922.4 |
| WACC, % | 7.56 | 7.56 | 7.56 | 7.56 | 7.56 | 7.56 | 7.56 | 7.56 | 7.56 | 7.56 |
| PV UFCF | ||||||||||
| SUM PV UFCF | -6,096.9 | |||||||||
| Long Term Growth Rate, % | 2.00 | |||||||||
| Free cash flow (T + 1) | -1,961 | |||||||||
| Terminal Value | -35,276 | |||||||||
| Present Terminal Value | -24,505 | |||||||||
| Enterprise Value | -30,602 | |||||||||
| Net Debt | 2,094 | |||||||||
| Equity Value | -32,696 | |||||||||
| Diluted Shares Outstanding, MM | 538 | |||||||||
| Equity Value Per Share | -60.79 |
What You Will Receive
- Authentic RemeGen Financial Data: Access to both historical and projected figures for precise evaluation.
- Customizable Parameters: Adjust WACC, tax rates, revenue growth, and capital expenditures to fit your analysis.
- Instant Calculations: Intrinsic value and net present value are computed in real-time.
- Scenario Evaluation: Explore various scenarios to assess RemeGen's future prospects.
- User-Friendly Interface: Designed for professionals while remaining approachable for newcomers.
Key Features
- Accurate Financial Data: Gain access to precise historical figures and future forecasts for RemeGen Co., Ltd. (9995HK).
- Adjustable Forecast Parameters: Modify the highlighted cells for variables such as WACC, growth rates, and profit margins.
- Real-Time Calculations: Automatic updates for Discounted Cash Flow (DCF), Net Present Value (NPV), and cash flow analyses.
- User-Friendly Dashboard: Clear charts and summaries to help you understand your valuation insights easily.
- Designed for All Levels: An intuitive layout tailored for investors, CFOs, and consultants alike.
How It Functions
- Download: Get the pre-built Excel file containing RemeGen Co., Ltd.'s (9995HK) financial data.
- Customize: Modify projections, such as revenue growth, EBITDA %, and WACC according to your analysis.
- Real-Time Updates: Intrinsic value and NPV calculations refresh automatically with your data changes.
- Scenario Testing: Generate various projections and evaluate the results instantly.
- Strategic Decisions: Leverage the valuation outcomes to inform your investment choices.
Why Opt for This Calculator?
- Reliable Data: Utilize authentic RemeGen Co., Ltd. financials for trustworthy valuation outcomes.
- Flexible Options: Modify essential inputs such as growth projections, WACC, and tax rates to fit your forecasts.
- Efficiency Boost: Built-in calculations save you the hassle of beginning from ground zero.
- Professional-Grade Solution: Tailored for investors, analysts, and consultants focusing on [9995HK].
- User-Friendly Design: A straightforward interface with detailed guidance ensures accessibility for all users.
Who Should Use RemeGen Co., Ltd. (9995HK)?
- Biotechnology Students: Explore drug development processes and apply theoretical knowledge to real-world cases.
- Researchers: Integrate advanced models and methodologies into your academic studies or scientific inquiries.
- Investors: Evaluate your investment strategies by analyzing the performance metrics of RemeGen Co., Ltd. (9995HK).
- Market Analysts: Enhance your analysis with a pre-designed, customizable DCF model tailored for biotech firms.
- Entrepreneurs: Understand how established biotech companies like RemeGen Co., Ltd. (9995HK) are assessed and valued.
Contents of the Template
- Preloaded RemeGen Data: Historical and projected financial metrics, including revenue, EBIT, and capital expenditures.
- DCF and WACC Models: Professional-grade spreadsheets for calculating intrinsic value and Weighted Average Cost of Capital.
- Editable Inputs: Yellow-highlighted cells for adjusting revenue growth rates, tax rates, and discount rates.
- Financial Statements: Detailed annual and quarterly financials for more in-depth analysis.
- Key Ratios: Metrics for profitability, leverage, and efficiency to assess performance.
- Dashboard and Charts: Visual representations of valuation outcomes and underlying assumptions.
Disclaimer
All information, articles, and product details provided on this website are for general informational and educational purposes only. We do not claim any ownership over, nor do we intend to infringe upon, any trademarks, copyrights, logos, brand names, or other intellectual property mentioned or depicted on this site. Such intellectual property remains the property of its respective owners, and any references here are made solely for identification or informational purposes, without implying any affiliation, endorsement, or partnership.
We make no representations or warranties, express or implied, regarding the accuracy, completeness, or suitability of any content or products presented. Nothing on this website should be construed as legal, tax, investment, financial, medical, or other professional advice. In addition, no part of this site—including articles or product references—constitutes a solicitation, recommendation, endorsement, advertisement, or offer to buy or sell any securities, franchises, or other financial instruments, particularly in jurisdictions where such activity would be unlawful.
All content is of a general nature and may not address the specific circumstances of any individual or entity. It is not a substitute for professional advice or services. Any actions you take based on the information provided here are strictly at your own risk. You accept full responsibility for any decisions or outcomes arising from your use of this website and agree to release us from any liability in connection with your use of, or reliance upon, the content or products found herein.